Structural deformation of PVDF nanoweb due to electrospinning behavior affected by solvent ratio
-
Young Jin Hwang


Abstract
In this study, we investigated the effects of solution characteristics on electrospinning behavior and nanoweb structure. We prepared a polyvinylidene fluoride (PVDF) solution by varying the ratios of N,N-dimethylformamide (DMF) and acetone in the solvent and fabricated nanowebs by electrospinning. We determined the solution characteristics of the PVDF solution with respect to the acetone ratio in the solvent. The effects of the solution characteristics on the electrospinning behavior were confirmed using a high-speed camera. We found significant differences in the electrospinning behavior. Thus, we investigated the effect of this difference on the morphology and structural properties of the fabricated nanoweb.
1 Introduction
Polyvinylidene fluoride (PVDF) is an organic material which has excellent chemical resistance, heat resistance, durability, flexibility and biocompatibility (1), (2). In addition, PVDF possesses various crystal structures contributed by the conformation of fluorine and hydrogen that are periodically bonded to the polymer chain (3), (4). In particular, the β-phase crystal structure of PVDF is a conformation in which intramolecular polarization is maximized, resulting in excellent electrical characteristics (5), (6). In addition, when PVDF is manufactured in the form of nanofibers, it has a large specific surface area. By exploiting the advantages of PVDF, it has been employed in many applications such as in filter materials, various sensors, secondary battery separators and cell scaffolds. In addition, PVDF can be replaced with a conventional ceramic piezoelectric device or can be used as a material in wearable devices (7), (8), (9), (10), (11), (12).
Among the methods of fiberizing PVDF, electrospinning is the most popular method because it is easy to obtain a β-phase crystal structure using this method. Electrospinning is a technique for producing nanofibers using the electrostatic force between a polymer solution droplet and a collector (13). During the process, the β-phase crystal structure of the PVDF is induced by the stretching action of the polymer and the electric field (14). As the process is simple, it is easy to install, thus facilitating mass production with low cost (15), (16).
Although the principle of electrospinning is simple, the spinning mechanism is complicated; studies on the stability analysis have been conducted (17). Electrospinning is affected by process parameters such as the nozzle diameter, applied voltage and tip-to-collector distance (TCD) (18), (19), (20). Moreover, it is influenced by solution properties such as concentration, viscosity, surface tension, vapor pressure and dielectric constant (21), (22), (23). Therefore, to establish stable spinning conditions and to control the fiber structure, the effects of these conditions must be understood.
In this study, the effects of solvent ratio on the electrospinning behavior and the characteristics of the collected nanoweb were compared and analyzed by investigating the solution characteristics such as viscosity, surface tension and volatility with respect to the ratio of acetone in the solvent. During the electrospinning process, the changes in the droplet and jet behaviors with respect to the solution characteristics were observed using a charge-coupled device (CCD) camera, and the effects of these changes on the morphology and three-dimensional structure of the nanoweb were analyzed.
2 Experimental procedure
2.1 Materials
N,N-dimethylformamide (DMF, Junsei Chemical Co. Ltd., Tokyo, Japan) and acetone (Duksan pure chemicals Co. Ltd., Ansan, Republic of Korea) were mixed with various DMF:acetone weight ratios, such as 10:0, 8:2, 6:4, 4:6 and 2:8, as a solvent. PVDF powder (Mw: 534,000, Sigma-Aldrich Inc., Saint Louis, MO, USA) was dissolved in the DMF:acetone solvent mixtures with a concentration of 15 wt%, and the mixture was magnetically stirred at 55°C for 6 h. The prepared solutions were denoted as A0, A2, A4, A6 and A8 with respect to the acetone content in the mixed solvents.
2.2 Electrospinning setup
The PVDF solution was fed into a metal nozzle with an inner diameter of 0.495 mm (21 G) at a pressure of 20 kPa by compressed air controlled by the regulator to maintain a constant feed rate. In this condition, the flow rates were measured at 4.14(A0), 5.81(A2), 9.47(A4), 12.86(A6), 14.21 ml/h (A8), respectively. A high voltage of 13 kV, generated by a high-voltage power supply (ESN-HV30, NanoNC Co. Ltd., Seoul, Republic of Korea), was applied to the nozzle, forming the same electric field between the nozzle and the grounded metal collector. The TCD was fixed at 15 cm. The resulting deposition, i.e. nanoweb, was collected during the electrospinning process for 10 min at the room temperature of 20°C and the relative humidity of 50%, and subsequently dried for 12 h.
2.3 Characterization
The viscosity, conductivity and surface tension of the PVDF solutions were measured using a viscometer (DV-II+Pro, AMETEK Brookfield Inc., MA, USA), a conductivity meter (HI 8633, HANNA Instruments Inc., Rhode Island, USA), and a surface tension meter (SEO-DST30M, SEO Ltd., Suwon, Republic of Korea), respectively, to determine the solution properties. The images of the drop hanging from the vertex of the nozzle tip (Figure 1A); and the jet, which is the entire material between the bottom of the drop and the collector (Figure 1B), were captured using a CCD camera (SCC-B2315, Samsung Electronics Co., Suwon, Republic of Korea) for 600 s with an interval of 1 s to investigate the dynamic behavior of electrospinning. The original images of the drop and jet were converted to black-and-white images by adjusting the critical value of the image intensity. The changes in the drop and jet areas with time were determined using a self-programmed image analysis tool. In addition, a high-speed camera (Phantom Miro eX2, Vision Research Inc., NJ, USA) was used to capture the jet behavior in a more detailed manner.

Images of (A) drop and (B) jet area, captured using the CCD camera during the electrospinning process.
The grayscale images of the deposited nanoweb, captured using a scanner (PIXMA E510, Canon Inc., Tokyo, Japan), were converted into corresponding contour images to analyze the distribution of the deposition. The morphologies of the nanoweb were observed using a field-emission scanning electron microscope (SUPRA25, Carl Zeiss Co. Ltd., Oberkochen, Germany), and the diameters of the nanofibers were calculated using a software (i-Solution Lite, IMT i-Solution Inc., Vancouver, Canada). The compression test conducted on the nanoweb was evaluated using a universal testing machine (Texture Analyzer, Yeonjin Corp., Seoul, Republic of Korea) by applying a compression load at a rate of 0.1 mm/s.
3 Results and discussion
The electrospinning behavior is significantly affected by the applied electrical force and solution properties including surface tension, viscosity and conductivity. Therefore, the solution properties are determined, as listed in Table 1. Both the surface tension and the shear viscosity gradually decrease from 39.7 dyne/cm and 2549.5 cP to 24.8 dyne/cm and 959.8 cP, respectively, with the increase in the acetone ratio in the solvent, because acetone weakens the molecular interaction between the components of the PVDF solution, as it is a non-solvent additive (24). The conductivity gradually increases up to 24.4 μs/cm for A8 solution with the increase in the amount of acetone, implying that A8 can be electrically charged very easily.
Characteristics of PVDF solutions used in this study.
| Surface tension (dyne/cm) | Viscosity (cP) | Conductivity (μs) | |
|---|---|---|---|
| A0 | 39.7 | 2549.5 | 13 |
| A2 | 34.9 | 1889.6 | 16.3 |
| A4 | 29.7 | 1499.7 | 17.7 |
| A6 | 27.4 | 1154.8 | 20.7 |
| A8 | 24.8 | 959.8 | 24.4 |
The instability of the drop hanging from the vertex of the nozzle tip was investigated, as it is the first step in the electrospinning process. The change in the drop area, which represents the amount of droplet, is decided by the balance between the rate of solution flowing out from the nozzle and the rate of jet ejecting from the drop. The rate of solution flowing out is affected by the shear viscosity of the solution, while the rate of jet ejection is affected by the surface tension and the charge repulsion force, induced by an applied voltage of 13 kV. As shown in Figure 2A, even though the shear viscosity decreases with the increase in the acetone ratio, the drop areas corresponding to A0, A2, A4 and A6 solutions remain constant with respect to time at the same applied voltage, because of the decrease in the surface tension. However, for the A8 solution, the drop area changes unstably with time. When the acetone proportion in the solvent is extremely high, the PVDF solution rapidly solidifies because of the high evaporating rate of acetone, which has a high vapor pressure (25).

(A) Change in the drop area during the electrospinning process for 600 s, and (B) corresponding images of the drop change for A8, indicated by black arrows in (A).
The electrospun jet area represents the amount of solution ejected from the drop. Moreover, the jet shape affects the formation of the resultant deposition. The change in the jet area is one of the important parameters to be investigated. The average jet area increases with the increase in the acetone ratio up to A6, as shown in Figure 3A. The increased amount of jet was because of the higher rate of jet ejection due to the gradually decreasing surface tension and the increasing chargeability of the solution at the same applied voltage with the increase in the acetone ratio, as mentioned previously. However, the jet amount for A8 decreases slightly, and the reason can be seen in Figure 3B. It was confirmed that the density of the jet for the same TCD increases, from A0 to A6; however, the jet for A8 formed in a smaller region with a narrower spinning angle. Moreover, the unstable change in the jet area for A8 was affected by the unstable drop change, as shown in Figure 2.

(A) Change in the jet area during the electrospinning process for 600 s, and (B) corresponding jet images captured using the CCD camera.
To observe the dynamic behavior, the jet shapes were captured using a high-speed camera. In Figure 4, the jet behavior differs markedly with respect to the acetone ratio in the solution. The jets of A0 and A2 solutions were broken while stretching, and a fibrous image was rarely observed, as shown in Figure 4A and B. However, with the increase in the acetone content, the breakage phenomenon is reduced, and a clear fibrous image appears. The friction between the PVDF molecules was not high enough to overcome the drawing force, resulting in jet breaking. When acetone is added, the driving jet is solidified rapidly before it exceeds the elongation limit because of the increased volatility of the solvent. In addition, as the elongation rate decreases because of the rapid solidification, the bending radius of the whipping jet becomes smaller, as shown in Figure 4C–E.

The jet images of (A) A0, (B) A2, (C) A4, (D) A6 and (E) A8, captured using the high-speed camera with an exposure time of 20 μs.
Figure 5 shows the contour analysis of the deposition of the spun solutions, obtained using threshold processing. The gray scale light intensities of the image were filtered in 10 steps from 60 to 240 for evaluating the distribution of the deposition (26). In the graph shown in Figure 5A, the area filtered at 60 (minimum intensity of the fiber) was found to be the widest for A2 and the narrowest for the acetone-added solution. This can also be seen in the image shown in Figure 5B. This is because of the reduction in the bending radius of the jet due to the elongation difference, as shown in the high-speed camera image analysis (Figure 4). The area of A2 is 0 when the intensity is above 168. The intensity represents the fiber density, and the fact that the area reached zero at a lower intensity compared to that of the other samples shows that the web was not collected more densely than the other samples.
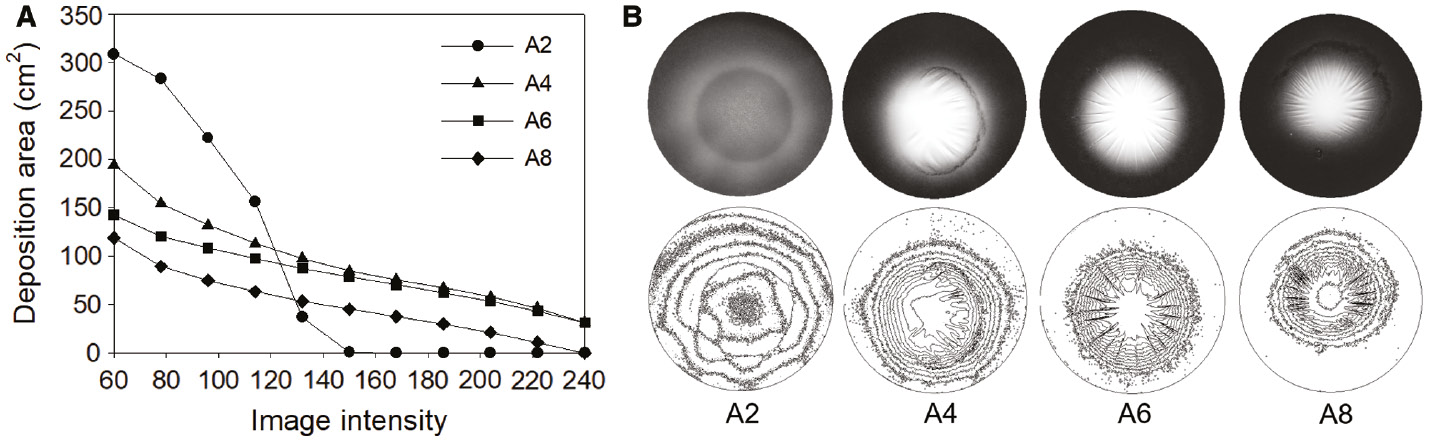
(A) Contour analysis of web deposition through threshold processing and (B) corresponding web images.
Figure 6 shows the morphology changes with respect to the acetone content. The A0 solution was collected in the form of a film shape and not as a fiber, and the A2 solution was collected in a mixed deposition of beads and fibers, resulting from the jet breaking. However, beads did not appear in A4, which had a higher acetone ratio. This is because of the difference in the jet behavior depending on the solution characteristics (Figure 4), and it was confirmed that the increase in the proportion of acetone improves the fiber formation.
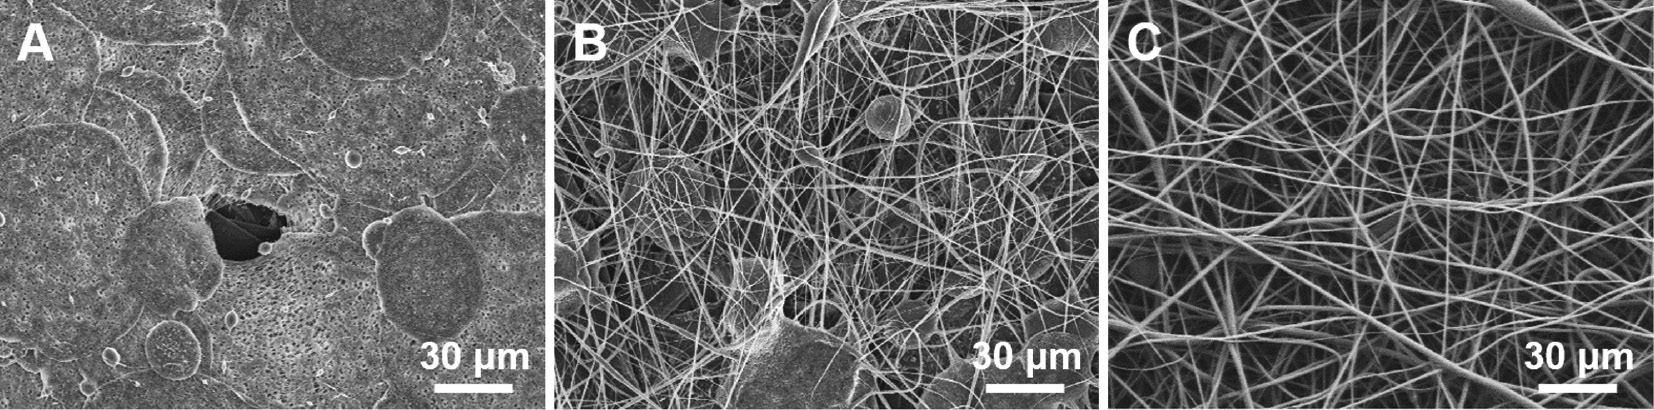
FE-SEM images of nanoweb obtained by electrospun: A) A0, B) A2, and C) A4.
Figure 7 shows the fiber diameter distribution of the electrospun nanowebs. The average diameters of the electrospun nanowebs of A2, A4, A6 and A8 are 0.73 μm, 1.25 μm, 1.82 μm and 2.03 μm, respectively. It was found that the increased ratio of acetone led to an increase in the fiber diameter, because the volatility of acetone restricts the jet elongation, thus increasing the diameter.

Fiber diameter distribution of electrospun nanowebs.
Figure 8 shows the cross-sectional Field emission scanning electron microscopy (FE-SEM) image for the thickness analysis of the fabricated nanowebs. The thicknesses of the nanowebs of A2, A4, A6 and A8 were found to be 12.2 μm, 44.4 μm, 192.2 μm and 397.8 μm, respectively, despite the same collecting time. The increase in the thickness is due to the increase in the amount of jet and the average diameter of the fibers with the increase in the ratio of acetone. Also, the thickness of web is affected by the deposition area, and a relatively large amount of fibers is stacked in the small area (Figure 5). Moreover, with the increase in the ratio of acetone, the fibers become more solidified when they are stacked on the collector because of the high volatility, thus the stiff fibers could make the web thicker.

Cross sectional FE-SEM image of electrospun nanoweb and thickness analysis.
The higher number and greater thickness (of the fibers) of the resultant nanoweb were responsible for the formation of a more porous structure, exhibiting a different response in terms of the compressive property, as shown in Figure 9. The strain was greater when the ratio of acetone was higher at the same compressive stress.

Stress–strain curve of nanowebs under compression.
4 Conclusions
In this study, we examined the effect of varying the solvent on the electrospinning behavior and nanoweb structure for the fabrication of PVDF nanowebs by electrospinning. The solution characteristics differed depending on the ratio of acetone in the solvent. Moreover, it was found that the solution characteristics are important factors affecting the drop and jet behaviors during electrospinning, causing significant changes in the morphology, fiber diameter, and three-dimensional structural properties of the nanowebs. In summary, this study demonstrates that it is possible to establish stable electrospinning conditions and to control the structure of the nanoweb by selectively controlling the properties of the solvent.
Acknowledgments
This research was supported by a grant from the Individual Basic Science & Engineering Research Program (NRF-2015R1D1A1A01057302) funded by Ministry of Education, Republic of Korea.
References
1. Andrew JS, Clarke DR. Effect of electrospinning on the ferroelectric phase content of polyvinylidene difluoride fibers. Langmuir 2008;24(3):670–2.10.1021/la7035407Search in Google Scholar
2. Rocha JG, Gonclaves LM, Rocha PF, Lanceros-Mendez S. Energy harvesting from piezoelectric materials fully integrated in footwear. IEEE T Ind Electron. 2010;57(3):813–9.10.1109/TIE.2009.2028360Search in Google Scholar
3. Mohammadi B, Yousefi AA, Bellah SM. Effect of tensile strain rate and elongation on crystalline structure and piezoelectric properties of PVDF thin films. Polym Test 2007;26(1):42–50.10.1016/j.polymertesting.2006.08.003Search in Google Scholar
4. Lovinger AJ. Poly(vinylidene fluoride). Dordrecht: Springer; 1982. pp. 195–273.10.1007/978-94-009-7343-5_5Search in Google Scholar
5. Salimi A, Yousefi AA. FTIR studies of β-phase crystal formation in stretched PVDF films. Polym Test 2003;22(6):699–704.10.1016/S0142-9418(03)00003-5Search in Google Scholar
6. Salamone JC. Polymeric materials encyclopedia. New York: CRC Press; 1996. pp. 7115–7122.Search in Google Scholar
7. Li H, Chen YM, Ma XT, Shi JL, Zhu BK, Zhu LP. Gel polymer electrolytes based on active PVDF separator for lithium ion battery. I: Preparation and property of PVDF/poly(dimethylsiloxane) blending membrane. J Membrane Sci. 2011;379(1):397–402.10.1016/j.memsci.2011.06.008Search in Google Scholar
8. Ribeiro C, Sencadas V, Correia DM, Lanceros-Méndez S. Piezoelectric polymers as biomaterials for tissue engineering applications. Colloid Surface B. 2015;136(1):46–55.10.1016/j.colsurfb.2015.08.043Search in Google Scholar PubMed
9. Ahn Y, Lim JY, Hong SM, Lee J, Ha J, Choi HJ, Seo Y. Enhanced piezoelectric properties of electrospun poly(vinylidene fluoride)/multiwalled carbon nanotube composites due to high β–phase formation in poly(vinylidene fluoride). J Phys Chem C. 2013;117(22):11791–9.10.1021/jp4011026Search in Google Scholar
10. Lang CH, Fang J, Shao H, Wang HX, Yan GL, Ding X, Lin T. High-output acoustoelectric power generators from poly(vinylidenefluoride-co-trifluoroethylene) electrospun nano-nonwovens. Nano Energy 2017;35(1):146–53.10.1016/j.nanoen.2017.03.038Search in Google Scholar
11. Dorneanu PP, Cojocaru C, Olaru N, Samoila P, Airinei A, Sacarescu L. Electrospun PVDF fibers and a novel PVDF/CoFe2O4 fibrous composite as nanostructured sorbent materials for oil spill cleanup. App Surf Sci. 2017;424(1):389–96.10.1016/j.apsusc.2017.01.177Search in Google Scholar
12. Huang T, Wang C, Yu H, Wang HZ, Zhang QH, Zhu MF. Human walking-driven wearable all-fiber triboelectric nanogenerator containing electrospun polyvinylidene fluoride piezoelectric nanofibers. Nano Energy 2015;14(1):226–35.10.1016/j.nanoen.2015.01.038Search in Google Scholar
13. Ding B. Electrospinning, fibers and textiles: a new driving force for global development. e-polymers 2017;17(3):209–10.10.1515/epoly-2016-0299Search in Google Scholar
14. Baji A, Mai YW, Li Q, Liu Y. Electrospinning induced ferroelectricity in poly(vinylidene fluoride) fibers. Nanoscale 2011;3(8):3068–71.10.1039/c1nr10467eSearch in Google Scholar
15. Formhals A. Process and apparatus for preparing artificial threads. U.S. Patent 1-975-504; 1934.Search in Google Scholar
16. Li D, Xia YN. Electrospinning of nanofibers: reinventing the wheel? Adv Mater. 2004;16(14):1151–70.10.1002/adma.200400719Search in Google Scholar
17. Ye NK, Kim HS. Fundamental studies on the electrospinning instability for controlling the electrospinning process. Text Sci Eng. 2012;49(4):250–4.10.12772/TSE.2012.49.4.250Search in Google Scholar
18. Renker DH, Chun I. Nanometre diameter fibres of polymer, produced by electrospinning. Nanotechnology 1996;7(3):216–23.10.1088/0957-4484/7/3/009Search in Google Scholar
19. Liu J, Kumar S. Microscopic polymer cups by electrospinning. Polymer 2005;46(10):3211–4.10.1016/j.polymer.2004.11.116Search in Google Scholar
20. Fong H, Chun I, Renker DH. Beaded nanofibers formed during electrospinning. Polymer 1999;40(16):4585–92.10.1016/S0032-3861(99)00068-3Search in Google Scholar
21. Choi JW, Lee KH, Hwang SH, Kim JY, Lee SW, Huh WS. Study of polycarbonate/MWNT electrospun nanofiber and its multi-filament application. J Korean Ind Eng Chem. 2008;19(4):413–20.Search in Google Scholar
22. Lee KH, Kim HY, Bang HJ, Jung YH, Lee SG. The change of bead morphology formed on electrospun polystyrene fibers. Polymer 2003;44(14):4029–34.10.1016/S0032-3861(03)00345-8Search in Google Scholar
23. Li D, Xia YN. Fabrication of titania nanofibers by electrospinning. Nano Lett. 2003;3(4):555–60.10.1021/nl034039oSearch in Google Scholar
24. Fontananova E, Jansen JC, Cristiano A, Curcio E, Drioli E. Effect of additives in the casting solution on the formation of PVDF membranes. Desalination 2006;192(1):190–7.10.1016/j.desal.2005.09.021Search in Google Scholar
25. Illangakoon UE, Mahalingam S, Matharu RK, Edirisinghe M. Evolution of surface nanopores in pressurised gyrospun polymeric microfibers. Polymers 2007;9(10):1–11.10.3390/polym9100508Search in Google Scholar PubMed PubMed Central
26. Kong CS, Yoo WS, Lee KY, Kim HS. Nanofiber deposition by electroblowing of PVA(polyvinyl alcohol). J Mater Sci. 2009;44(4):1107–12.10.1007/s10853-008-3209-6Search in Google Scholar
©2018 Walter de Gruyter GmbH, Berlin/Boston
This article is distributed under the terms of the Creative Commons Attribution Non-Commercial License, which permits unrestricted non-commercial use, distribution, and reproduction in any medium, provided the original work is properly cited.
Articles in the same Issue
- Frontmatter
- In this Issue
- Full length articles
- Synthesis, characterization and application of polypyrrole-cellulose nanocomposite for efficient Ni(II) removal from aqueous solution: Box-Behnken design optimization
- Biodegradable glucose and glucosamine grafted polyacrylamide/graphite composites for the removal of acid violet 17 from an aqueous solution
- Evaluation of activated composite membranes for the facilitated transport of phenol
- The effects of nanoparticles on morphology and thermal properties of erythritol/polyvinyl alcohol phase change composite fibers
- Rapid crystallization and mesophase formation of poly(L-lactic acid) during precipitation from a solution
- Structural deformation of PVDF nanoweb due to electrospinning behavior affected by solvent ratio
- Poly(vinyl amine) as a matrix for a new class of polymers
- Review
- Polymeric advanced delivery systems for antineoplasic drugs: doxorubicin and 5-fluorouracil