
Comparative investigation of physical, mechanical and thermomechanical characterization of dental composite filled with nanohydroxyapatite and mineral trioxide aggregate
-
Anoj Meena


Abstract
This study presents comparative investigation of adding nanohydroxyapatite (HA) (5–20 wt.%) and mineral trioxide aggregate (MTA) (5–20 wt.%) on the physical, mechanical and thermomechanical characterization of dental composite. The performances of both experimental composites were assessed through various physical, mechanical and thermomechanical tests such as void content test, microhardness test, compressive strength test, dynamic mechanical analysis and thermogravimetric analysis. The result of experiment indicated that the addition of 5 wt.% of HA increased the water sorption, hardness and compressive strength by 50.47%, 13.46% and 62.35%, respectively, whereas the addition of 5 wt.% of MTA increased the water sorption, hardness and compressive strength by 19.23%, 100% and 5.44%, respectively. Dynamic mechanical analysis results revealed that the addition of 5 wt.% HA increased the storage modulus by 10.21%, whereas the addition of 5 wt.% of MTA decreased the storage modulus by 11.79%. The filler HA proved to be better choice in term of thermal stability behavior as compare to MTA filler.
1 Introduction
Since 1980, the main challenges for the dental material scientist were to develop ideal dental materials that can withstand the adverse oral conditions related to excessive loading, erosive environments and temperature variations. Therefore, various dental composites were developed and investigated by modifying types of filler, size, shapes and content (1), (2), (3), (4). In this regard, nanoalumina, nanosilica and nanozirconia have been popularly used as filler in dental composite material (5), (6), (7). However, the formulations of composite have been continuously modified by varying filler morphology, surface treatment and fabrication technique (8), (9), (10), (11). Among ceramic biomaterials, hydroxyapatite (Ca10(PO4)6(OH)2) is considered as the most preferred choice for hard tissue replacement and dental implant material (12), (13), (14), (15). As a main mineral component of bones and teeth, hydroxyapatite is biocompatible, osteoconductive and possesses good mechanical properties (16). It was also reported that the presence of hydroxyapatite improved the ingrowth of tissue forming cell and the interfacial interaction strength between tissue and cement (17), (18). However, the applications of hydroxyapatite are limited because of low strength and brittle nature (19). Hence, the addition of nanohydroxyapatite (HA) in the reinforcement of organic-based cements improved the mechanical and biological properties. Nowadays, visible-light-cured dental composite materials are extensively used in several dentistry applications because of their excellent aesthetics and the improvements in the chemical and mechanical resistance reached in the last years. When the composite resins are irradiated, the radicals generated attack the double bonds of the monomers, creating cross-linked three-dimensional network polymers (20). However, during polymerization, the presence of voids may lead to increase in the water sorption of dental composite. The increase in water sorption of dental composite can break the chemical bond between filler and resin matrix by hydrolysis reaction, expand the volume of composite and finally lead to a decrease in the mechanical properties of dental resin composites (21). The presence of the viscous part of resin results into their viscoelastic behavior that is tested using dynamic mechanical analyzer. In this study, HA filler was compared with mineral trioxide aggregate (MTA). MTA was developed by Torabinejad and White (22) for use as a dental root repair material. MTA is composed of tricalcium silicate, dicalcium silicate, tricalcium aluminate, tetracalcium aluminoferrite, calcium sulfate and bismuth oxide. MTA is used for repairing root perforations during root canal therapy and treating internal root resorption, root-end filling material and pulp-capping material. Studies have shown that an MTA apical barrier and MTA root filling for sheep and bovine teeth (in vitro and in vivo) showed higher strength, hardness and fracture resistance in comparison with teeth filled with calcium hydroxide (23), (24), (25). However, detailed analysis of the addition of MTA on the physical, mechanical and thermomechanical characterization of dental composite is lacking in literatures.
Therefore, the objectives of this study were to compare resin-based composite reinforced with MTA and hydroxyapatite at different filler ratios and to evaluate their compressive strength, Vickers hardness, void content, water absorption, storage modulus, loss modulus, tan delta, glass transition temperature, mass loss, etc.
2 Experimental
2.1 Fabrication of proposed dental materials
The resin matrix was prepared using the mixture of monomers BisGMA (Esstech Inc., Essington, PA, USA) and TEGDMA (TCI Japan) with weight percent 50/45. The Camphorquinone (Spectrochem, Mumbai, India) (0.2% by weight of resin matrix) was added to the resin matrix as an initiator followed by the addition of dimethyl amino ethyl methacrylate (DMAEMA) (Sigma Aldrich, Bangalore, India) (0.8% by weight of resin matrix) as a co-initiator. Hydroxyapatite (size: 20–80 nm) was purchased from Sarthak Sales, Jaipur, India, and MTA from Vishal Health Care, Jaipur, India, respectively. Table 1 presented nine different samples made by adding 0, 5, 10, 15 and 20 wt.% of filler into the resin matrix (i.e. DC-0: unfilled; DCH-5: 5 wt.% hydroxyapatite filled; DCH-10: 10 wt.% hydroxyapatite filled; DCH-15: 15 wt.% hydroxyapatite; DCH-20: 20 wt.% hydroxyapatite-filled dental composites; DCMT-5: 5 wt.% MTA filled; DCMT-10: 10 wt.% MTA filled; DCMT-15: 15 wt.% MTA; and DCMT-20: 20 wt.% MTA-filled dental composites) respectively. The container was covered with aluminum foil to reduce light initiated polymerization.
Detailed composition of unfilled and particulate-filled dental composite.
| Sample designation | Composition |
|---|---|
| DC-0 (unfilled dental composite) | 52 wt.% BisGMA, 45 wt.% TEGDMA, 2% BHT, 0.2 wt.% CQ and 0.8 wt.% DMAEMA |
| DCH-5 (dental composite with 5% HA filler) | 52 wt.% BisGMA, 45 wt.% TEGDMA, 2% BHT,0.2 wt.% CQ and 0.8 wt.% DMAEMA + 5% HA filler |
| DCH-10 (dental composite with 10% HA filler) | 52 wt.% BisGMA, 45 wt.% TEGDMA, 2% BHT, 0.2 wt.% CQ and 0.8 wt.% DMAEMA + 10% HA filler |
| DCH-15 (dental composite with 15% HA filler) | 52 wt.% BisGMA, 45 wt.% TEGDMA, 2% BHT, 0.2 wt.% CQ and 0.8 wt.% DMAEMA +15% HA filler |
| DCH-20 (dental composite with 20% HA filler) | 52 wt.% BisGMA, 45 wt.% TEGDMA, 2% BHT, 0.2 wt.% CQ and 0.8 wt.% DMAEMA + 20% HA filler |
| DCMT-5 (dental composite with 5% MTA) | 52 wt.% BisGMA, 45 wt.% TEGDMA, 2% BHT, 0.2 wt.% CQ and 0.8 wt.% DMAEMA + 5% MTA |
| DCMT-10 (dental composite with 10% MTA) | 52 wt.% BisGMA, 45 wt.% TEGDMA, 2% BHT, 0.2 wt.% CQ and 0.8 wt.% DMAEMA + 10% MTA |
| DCMT-15 (dental composite with 15% MTA) | 52 wt.% BisGMA, 45 wt.% TEGDMA, 2% BHT, 0.2 wt.% CQ and 0.8 wt.% DMAEMA + 15% MTA |
| DCMT-20 (dental composite with 20% MTA) | 52 wt.% BisGMA, 45 wt.% TEGDMA, 2% BHT, 0.2 wt.% CQ and 0.8 wt.% DMAEMA + 20% MTA |
3 Characterization of the samples
3.1 Fourier transform infrared (FTIR) spectroscopy
The chemical characterization of dental composite due to addition of HA and MTA were carried out in FTIR spectroscopy (Perkin Elmer FTIR Spectrum) equipped with 4000–400 cm−1 wave range and 4 cm−1 resolution using the attenuated total reflection method. The structural changes in the dental composite due to increase in filler content were also examined.
3.2 Porosity and water sorption test
Glass mold (5 mm diameter and 6 mm height) was used to prepare various specimen of dental composites with HA and MTA filler content (0–20 wt.%). The curing of specimen was performed for 40 s on both sides using the light curing unit (LED, Dentmark, Mumbai, India) with a wavelength of 470 nm. Then the specimen was kept in deionized water at 37°C for 24 h to ensure complete curing. The specimen was placed in the burnout furnace at 80°C for 10 h for complete removal of moisture. Then the specimen was weighed in high-precision weighing machine and recorded as m1. Now, the specimen was placed in the deionized water for a week. After a week, the specimen was removed and dried carefully using a tissue paper to remove excess water on the surface of sample. Then their weights were measured as final weight m2. The water sorption in μg/mm3 is calculated by Eq. [1]
3.3 Vickers microhardness test
Specimens of size (10 mm diameter and 6 mm length) with varying filler content of HA and MTA (0–20 wt.%) were prepared. Curing of specimens were performed as same as in water sorption test. Then 500 g was applied up to 30 s on the machine Vickers microhardness tester (Walter UHL VMHT, UK). Six indentations were made on the surface of sample, and the mean value (d) of six indentations on each sample was recorded. The Hv values were calculated according to the ASTM E384-11e1 standard using Eq. [2].
3.4 Compression testing
The compression strength testing was performed for the postcured specimen of dimension (Ø5×6 mm) on Universal Testing machine UTM (Instron 1195) as per ASTM standard D695-08. The compressive strength (σc) was calculated using the Eq. [3].
where D is the diameter of pin size sample and P the applied normal load.
3.5 Dynamic mechanical analysis
The specimens for dynamic mechanical analysis (DMA) were fabricated in the glass mould of size Ø 5.30×6.2 mm2. DMA tests of postcured specimens were performed in Perkin Elmer Pyris-7 Dynamic Mechanical analyzer at a frequency of 1 Hz in the compression mode. Storage modulus (E′), loss modulus (E″) and loss tangent (Tanδ) were recorded against temperature in the range of 30°C–350°C at a heating rate of 2°C/min.
3.6 Thermogravimetric analysis
Thermogravimetric analysis (TGA) has been conducted on a simultaneous thermal analyzer Perkin Elmer Pyris-7 instrument to study the thermal stability behavior and thermal degradation temperature of dental composite filled with HA and MTA filler in the percentage of 0–20 wt.%. Samples were heated under nitrogen atmosphere from 30°C to 350°C at a heating rate of 10°C/min.
4 Results and discussion
4.1 FTIR spectra of HA- and MTA-filled composites
The FTIR spectroscopy of dental composites filled with different weight percentages of HA and MTA fillers is presented in Figures 1 and 2 , respectively. Hydroxyapatite consists of hydroxy and phosphate ion of calcium. In Figure 1, the absorption due to stretching vibration modes from phosphates group ((PO4)−3) and hydroxyl groups was characterized. The asymmetric stretching mode of vibration was characterized by a strong, complex band in the range of intensity 1125–1245 cm−1. The symmetric stretching vibration was characterized by a medium intensity band at approximately 828.66 cm−1. The bending vibration of PO43− was observed by bands located at 560 cm−1. The crystalline HA generates characteristic O-H bands at approximately 3430, which were noticed in all the FTIR spectra (26). The intensity of these peaks increased with increase in calcination temperature and is attributed to the conversion of HA to TCP and Ca-O at higher temperature. The peaks at 1450–1700 cm−1 indicated the existence of a Ca-O phase in the structure. As the HA filler content increased, the loss of -OH groups was observed. Also, the cured composites based on monomers with high molecular weight such as BisGMA and TEGDMA exhibit a considerable number of remaining double bonds (27), (28).
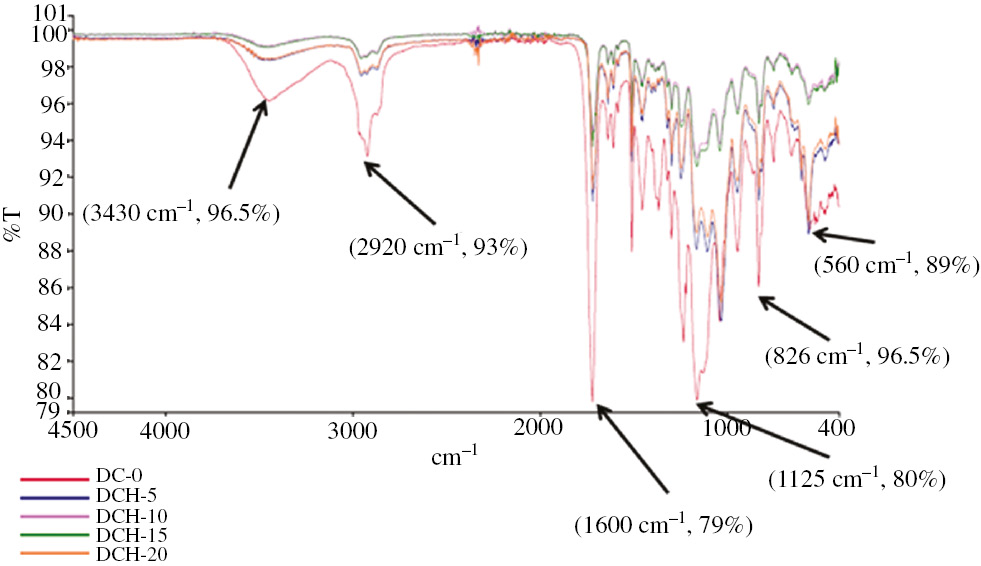
FTIR spectra of HA-filled composites.
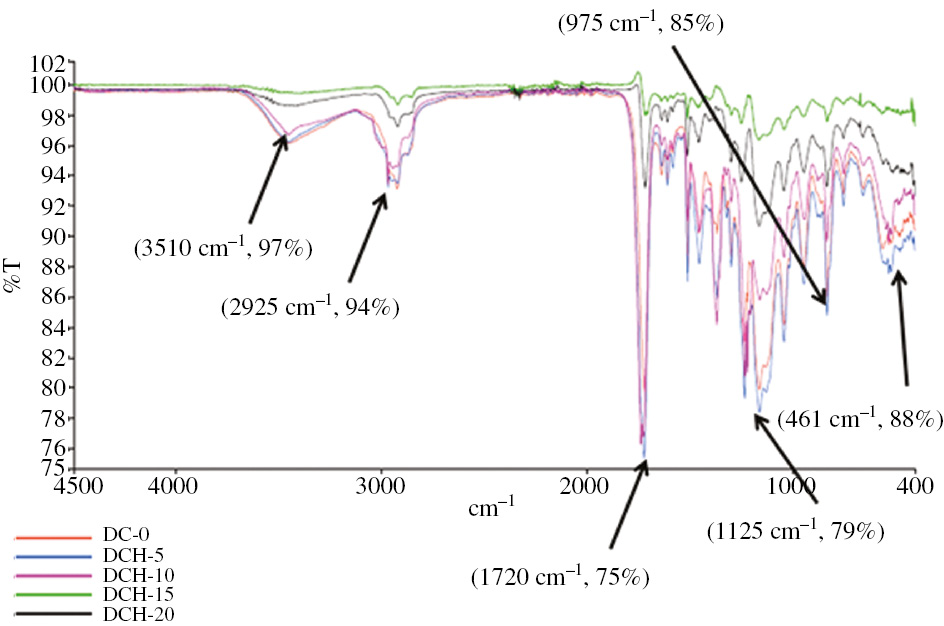
FTIR spectra of MTA-filled dental composites.
Figure 2 indicates FTIR spectra of dental composite filled with MTA. As the spectra of MTA showed, the splitting of the band in the 850–1060 cm−1 region resulted from the presence of silicate phases. The bands in the 1360–1730 cm−1 corresponded to the asymmetric stretching of the group. A broad peak indicated 3100–3800 cm−1 and a small peak between 2922 and 2970 cm−1 was related to the OH. The bands specific for calcium silicates hydrates such as for silicates (461 cm−1; 975 cm−1) and OH- (3510 cm−1, 2925 cm−1) are also present on the FTIR spectrum (29), (30), (31). The components at 461 cm−1, due to the vibration modes of poorly polymerized silicate tetrahedral bending modes, respectively, were observed for all the un-hydrated materials (32).
4.2 Effect of porosity on HA- and MTA-filled composites
The physical and mechanical properties of HA and MTA-filled dental composite are presented in Table 2. Table 2 also indicates that there is presence of some pores or voids in the dental composite that is why the theoretical density differs from the apparent density. The presence of pores in the dental composites has detrimental effect on the mechanical performance of composites. It is also well accepted that the knowledge about void content is desirable for determining of the quality of the composites. The pore texture in dental cements arises from two sources: selective dissolution of some components and unreacted water or entrapped air (33). The mixing and consolidation of two or more different material parts during fabrication of the proposed hydroxyapatite- and MTA-filled dental composites results in formation of void. Hence, the physical and mechanical properties of dental composite strongly depend on the factors such as filler content, interfacial strength between resin and filler and oral environment (34), (35). Rodrigues et al. (36) proposed that material microstructure and porosity percentage were two important factors to influence the wear performance of dental composite. They further added that increase in the porosity percentages in the dental composite resulted in the decrease in mechanical and wear performance of dental composites.
Effect of varying HA and MTA on physical and mechanical properties of dental composite.
| S. No. | Composition | Theoretical density (gm/mm3) | Experimental density (gm/mm3) | Void content (%) | Water sorption (wt.%) | Hardness (Hv) | Compressive strength (MPa) |
|---|---|---|---|---|---|---|---|
| 1 | DC-0 | 1.247 | 1.245 | 0.16 | 1.05 | 78 | 300 |
| 2 | DCH-5 | 1.066 | 1.064 | 0.19 | 1.58 | 88 | 488 |
| 3 | DCH-10 | 1.096 | 1.093 | 0.27 | 2.15 | 112 | 527 |
| 4 | DCH-15 | 1.113 | 1.109 | 0.36 | 2.84 | 132 | 354 |
| 5 | DCH-20 | 1.084 | 1.078 | 0.56 | 3.50 | 150 | 339 |
| 6 | DCMT-5 | 1.104 | 1.101 | 0.27 | 1.24 | 156 | 317 |
| 7 | DCMT-10 | 1.062 | 1.058 | 0.38 | 1.69 | 219 | 338 |
| 8 | DCMT-15 | 1.042 | 1.038 | 0.39 | 1.76 | 243 | 350 |
| 9 | DCMT-20 | 1.086 | 1.079 | 0.65 | 1.96 | 292 | 363 |
4.3 Effect of water sorption on HA and MTA powder-filled dental composite
The water sorption of dental composite filled with different weight percentages of HA and MTA is also presented in Table 2. Table 2 revealed that the water sorption of for different weight percentage (0–20 wt.%) of HA filler particles was found to be 1.05%, 1.58%, 2.15%, 2.85% and 3.5%, respectively. Therefore, it can be observed that water sorption was improved with the addition of nanohydroxyapatite and further increased with the increase in HA filler content. Table 2 also revealed that the water sorption of for different weight percentage (0–20 wt.%) of MTA filler particles was found to be 1.05%, 1.24%, 1.69%, 1.76% and 1.96%, respectively. Therefore, it can be observed that water sorption was improved with the addition of MTA and further increased with the increase in MTA filler content.
Water absorption by a material is defined as the amount of water adsorbed into the body of the material through the exposed surface. In mouth, the dental composites remain in saliva or water for a long period. Hence, it becomes inevitable to study water sorption behavior of developed dental composite (37). Water sorption can affect the performance of dental composite in the following two ways:
When water is absorbed by the matrix of polymerized material, unreacted monomer will be leached out and create further shrinkage and loss in weight (38). The outward movement of ions or monomer may create further shrinkage and loss of weight of material.
However, in both the case, neither the shrinkage nor the expansion was uniform throughout the restoration material. Water sorption may affect composite resin materials by reducing their mechanical properties and wear resistance. The water sorption by the polymer matrix could cause filler-matrix debonding or even hydrolytic degradation of the fillers. The water sorption by composite resin materials is a diffusion-controlled process, and the water uptake occurs largely in the resin matrix.
4.4 Effect of hardness on HA- and MTA powder-filled dental composite
The hardness of dental composite filled with different wt.% of HA and MTA-filled dental composites were presented in the fifth column of Table 2. The hardness of the composite with 5, 10, 15 and 20 wt.% of HA particle reached to be 88, 112, 132 and 150 Hv, respectively, whereas the hardness of the composite with 5, 10, 15 and 20 wt.% of MTA was found to be 156, 219, 243 and 292 Hv, respectively. It was also revealed that the hardness of filled dental composite was significantly higher than the hardness of unfilled dental composite (78 Hv). In the resin-based dental composite, fillers are present in the strongest phase. The main purpose of filler is to strengthen composite and to reduce the amount of weak matrix material, resulting in the increase in hardness and strength and decrease in wear. From Table 2, it can be observed that the HA-filled dental composite indicated lower hardness value than the MTA-filled dental composite. This was attributed to the presence of more hard materials such as tricalcium silicate, dicalcium silicate, tricalcium aluminate, tetracalcium aluminoferrite, calcium sulfate and bismuth oxide in MTA as compared with HA.
4.5 Effect of compressive strength on HA and MTA powder-filled dental composite
The compressive strength of dental composite indicates the setting process and strength of the material (42). The compressive strength of 0, 5, 10, 15, 20 wt.% of HA-filled dental composite was obtained as 300, 488, 527, 354 and 339 MPa, respectively, whereas the compressive strength of 0, 5, 10, 15, 20 wt.% of MTA was obtained as 300, 317, 338, 350 and 363 MPa, respectively (Table 2). From Table 2, it can be observed that as the percentage of MTA content increased, the compressive strength increased simultaneously, whereas in case of hydroxyapatite, the compressive strength increased from 300 to 527 MPa with the introduction of 10% hydroxyapatite. However, further addition of hydroxyapatite (up to 20%) decreased the compressive strength to 339 MPa. The result was in agreement with the work in which it was reported that the compressive strengths of the bone cements were increased by approximately 10%, from 110 to 122 MPa with the introduction of 8% HA. Further addition of HA (up to 14%) decreased the compressive strength by approximately 4% (down to 105 MPa) (43). MTA shows the compressive strength of 317 MPa at 5% of filler content, which is also higher than the compressive strength of the human dentine reported as 297 MPa (44). The reason that may help to explain the observed compressive behavior is the degree of adhesion between the HA particles and the matrix. In a heterogeneous solid solution, poor adhesion between the components causes a decrease in yield stress as if the system were filled with voids.
4.6 DMA of HA and MTA-filled dental composites
The DMA of resin-based dental composites becomes essential because they exhibit visco-elastic behavior due to the presence of resin matrix. The DMA test simulates the cyclic masticatory loading to which resin composites are clinically subjected (45). The DMA provides relevant information about polymers, such as storage modulus (E′), loss modulus (E″) and loss tangent (Tanδ) and glass transition temperature (Tg). The storage modulus of dental composite reinforced with HA and MTA is shown in Figure 3. Figure 3 can be divided into three parts. First, in the temperature range 25°C–30°C, it can be seen that the linear plateau of storage modulus curve was observed because of presence of high stiff backbone chain. However, the further increase in temperature (50°C–100°C) led to increase in molecular mobility as well as vibrations and diffusion of molecules and chains. However, in thermosetting resin, the diffusion and molecular vibrations are hindered by the cross linked bonds. Hence, there is drastic decrease in the storage modulus of dental composite in the glass transition region. After the glass transition region (100°C–250°C), the storage modulus became constant due to the fact that molecules and chain achieve the molecular vibration with constant free volume. Therefore, it can be concluded that at low temperature, high cross-linked density led to high storage modulus. At high temperature, lower cross-linked density led to low storage modulus.
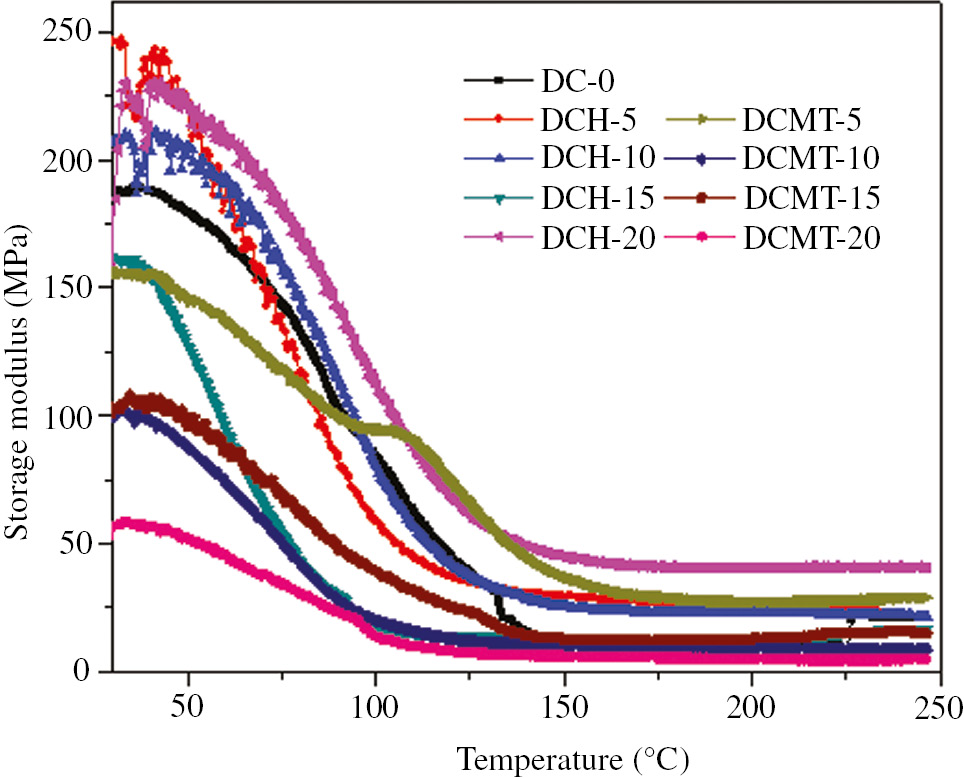
Variation of the storage modulus (E′) as a function of temperature for particulate-filled dental composite.
Figure 3 also indicated different trends for the addition of HA filler and MTA on the storage modulus of dental composite at different temperature. From Figure 3, it can be revealed that when HA filler was incorporated to unfilled matrix up to 5 wt.%, the storage modulus was increased. Further addition of filler up to 15 wt.%, storage modulus was decreased. However, further addition of filler 15–20 wt.% resulted in the increase in storage modulus. When MTA was added up to 10 wt.%, initially it decreased, but further addition of MTA from 10 to 15 wt.% led to the increase in storage modulus and from 15% to 20% further decrease in storage modulus. Increase in storage modulus with the increase in filler content was attributed to the addition of high modulus, brittle and ceramic inorganic oxide filler. Decrease in storage modulus with filler content may be due to improper interfacial bond between resin and fillers.
The loss modulus of HA- and MTA-filled dental composite is shown in Figure 4. In Figure 4, it was revealed that the loss modulus was increased with the increase in temperature for certain temperature range. Also, it can be seen that initially loss modulus was increased with the increase in temperature in the glassy region up to 75°C–100°C, but after attaining the maximum value at glass transition temperature, it started to decrease drastically in the glass transition region. Finally, it became constant in the rubbery region. Also, incorporation of HA decreased the loss modulus of dental composites. Further increase in the HA content in the range 5–10 wt.% resulted in the increase in loss modulus. However, further increase in the HA content in the range 10–20 wt.% resulted in the decrease in loss modulus. However, a similar trend of decrease in loss modulus was seen with the incorporation of MTA powder up to 5 wt.%, but further addition of MTA powder content up to 10 wt.% resulted in a drastic increase in loss modulus. However, further increase in the MTA powder up to 20 wt.% resulted in the decrease in loss modulus. Hence, we can conclude that the increase in filler content led to the increase in internal friction that increased the dissipation of energy. It resulted in the increase in loss modulus. However, decrease in loss modulus at different filler content may be due to close distribution of filler particles, weak interfacial bond between filler and resin or nonuniform dispersion of filler in the matrix.
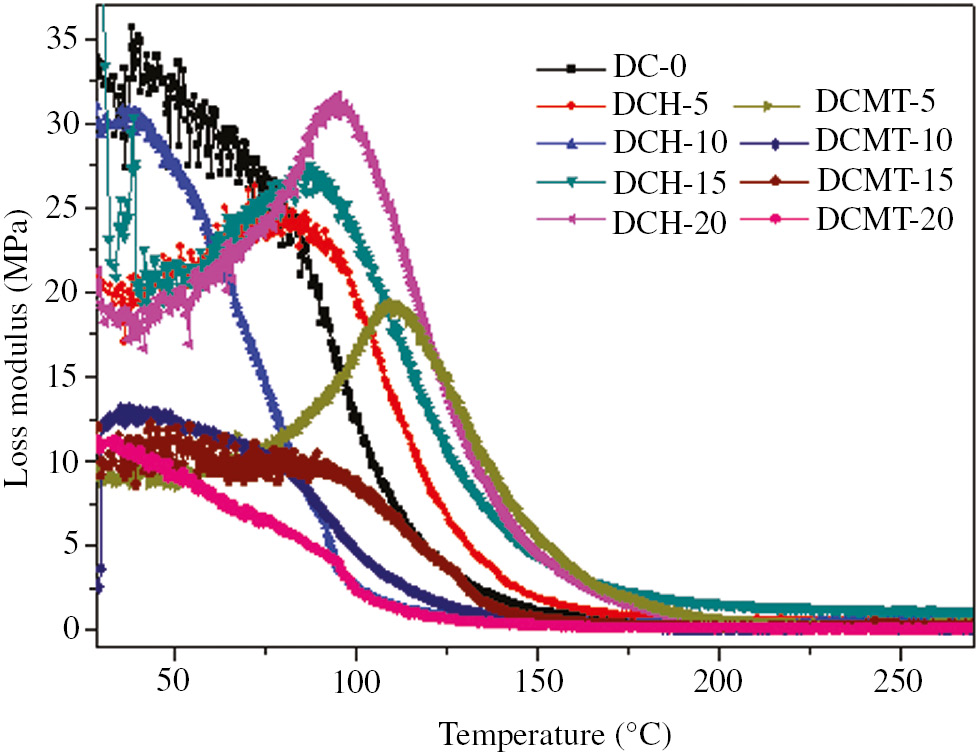
Variation of the loss modulus (E″) as a function of temperature for particulate-filled dental composite.
Tan delta versus temperature curves for HA- and MTA-filled dental composites obtained by DMA at a frequency of 1 Hz are shown in Figure 5. Again from Figure 5, it can be seen that the tan delta curve for dental composite without HA- and MTA was much broader than HA- and MTA-filled dental composite. This broad tan delta was attributed to the fact that unreacted carbon- carbon double bonds (C=C) of methacrylate groups formed wide range of polymer chain. Figure 5 also shows that the increase in HA led to the decrease in the tan delta and increase in glass transition temperature, whereas an increase in MTA did not show much change in glass transition temperature, which was in agreement with the loss modulus vs. temperature graph i.e. Figure 4. However, the tan delta of dental composite was decreased for 0–20 wt. MTA filled dental composite.
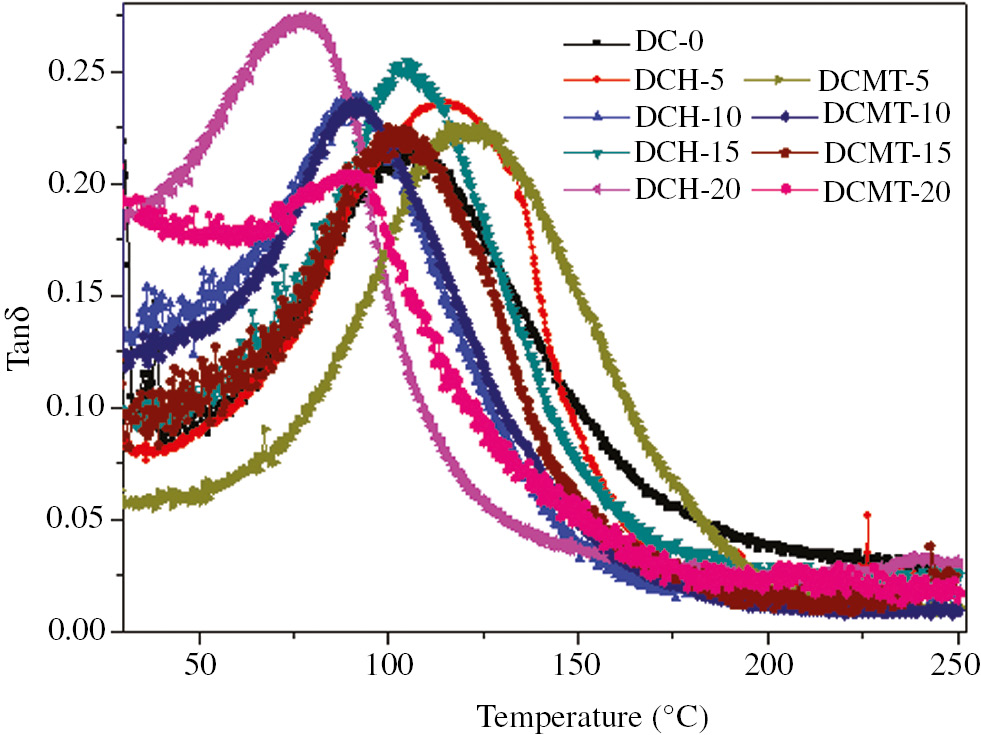
Variation of the tan delta (Tanδ) as a function of temperature for particulate-filled dental composite.
The glass transition temperature of the dental material should be higher than the temperature of the oral cavity to preserve the physical and mechanical properties of the material. The increase in intraoral temperatures beyond the glass transition temperature may lead to the softening of polymeric matrix and finally result in the clinical failure of the tooth restoration. Also, in the present work, all the developed experimental composites indicated glass transition temperature around 80°C–120°C, which was outside the range of oral cavity temperature (0°C–60°C).
4.7 TGA studies of HA- and MTA-filled dental composites
The TGA of dental composites filled with HA and MTA was performed using TGA to study their thermal behavior and is shown in Figure 6. Figure 6 clearly indicates that as the temperature increased, the dental composites degraded thermally with different rate. The temperature has been varied from 30 to 250°C to register the change in mass. It was observed that during the first 100°C, there was a weight loss of around 0.1 wt.% because of the loss of moisture or bound water. Further increase in temperature up to 175°C led to a drastic decrease in mass up to 3% because of thermal degradation. Finally, in the temperature range of 220°C–250°C, there was a complete decomposition of the polymer matrix. It was further revealed from Figure 6 that the thermal stability increased with the increase in HA content. Also, 20 wt.% HA-filled dental composite exhibited maximum thermal stability. Figure 6 clearly indicates that addition of MTA decreased the thermal stability drastically. Hence, the dental composite filled with 20 wt.% MTA indicated lowest thermal stability. Further, Figure 6 also shows that the HA proved to be better choice in term thermal stability behavior as compared with the MTA of dental composite. The thermal degradation in this study is obtained around 175°C.
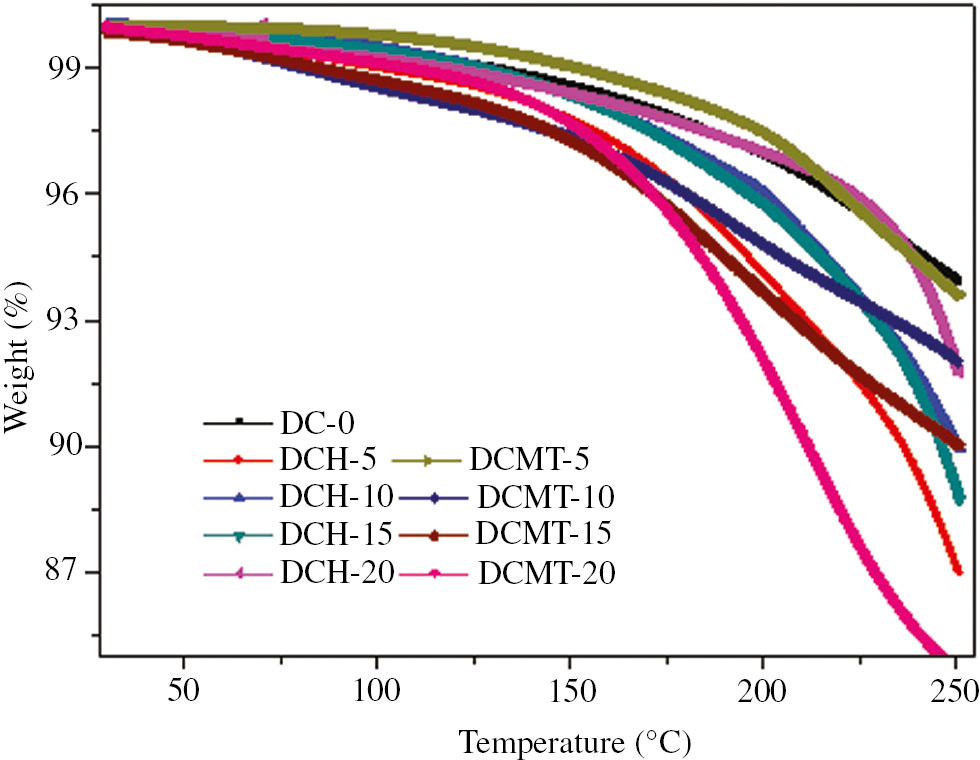
TGA thermograms of particulate filled dental composites.
5 Conclusions
Light-cured dental composites reinforced with different wt.% (0–20 wt.%) of HA and MTA filler have been fabricated. The incorporation of 5 wt.% of HA increased the water sorption, hardness and compressive strength by 50.47%, 13.46% and 62.35%, respectively, whereas the addition of 5 wt.% of MTA increased the water sorption, hardness and compressive strength by 19.23%, 100% and 5.44%, respectively. DMA results revealed that the addition of 5 wt.% HA increased the storage modulus by 10.21%, whereas the addition of 5 wt.% of MTA decreased the storage modulus by 11.79%. The thermal stability of dental composite was increased with the addition of HA up to 20 wt.% and decreased with the addition of MTA powder up to 20 wt.%. Finally, it was concluded that HA filler can be the better choice for the characteristics such as water sorption, compressive strength and thermal stability, whereas MTA filler MTA can be the better choice for the characteristics such as hardness and wear resistance of dental composite materials.
References
1. Lung CYK, Sarfraz Z, Habib A, Khan AS, Matinlinna JP. Effect of silanization of hydroxyapatite fillers on physical and mechanical properties of a bis-GMA based resin composite. J Mech Behav Biomed. 2016;54:283–94.10.1016/j.jmbbm.2015.09.033Suche in Google Scholar
2. Alsharif SO, Akil HBMd, El-Aziz NAA, Ahmad ZAB. Effect of alumina particles loading on the mechanical properties of light-cured dental resin composites. Mater Des. 2014;54:430–5.10.1016/j.matdes.2013.07.069Suche in Google Scholar
3. Venhoven BAM, de Gee AJ, Werner A, Davidson CL. Influence of filler parameters on the mechanical coherence of dental restorative resin composites. Biomaterials 1996;17(7):735–40.10.1016/0142-9612(96)86744-5Suche in Google Scholar
4. Kasraei SH, Atai M, Khamverdi Z, Nejad SK. The effect of nanofiller addition to an experimental dentin adhesive on microtensile bond strength to human dentin. J Dent. 2009;6(2):36–41.Suche in Google Scholar
5. Goncalves F, Azevedo CLN, Ferracane JL, Braga RR. BisGMA/TEGDMA ratio and filler content effects on shrinkage stress. Dent Mater. 2011;27:520–6.10.1016/j.dental.2011.01.007Suche in Google Scholar PubMed
6. Kumar SR, Patnaik A, Bhat IK. Analysis of polymerization shrinkage and thermomechanical characterizations of resin-based dental composite reinforced with silane modified nanosilica filler particle. Proc Inst Mech Eng L J Mater Des Appl. 2016;230:492–503.Suche in Google Scholar
7. Guo G, Fan Y, Zhang JF, Hagan JL, Hu X. Novel dental composites reinforced with zirconia-silica ceramic nanofibers. Dent Mater. 2012;28(4):360–8.10.1016/j.dental.2011.11.006Suche in Google Scholar PubMed PubMed Central
8. Abenojar J, Martínez MA, Velascol F, Pascual-Sanchez V, Martin-Martinez JM. Effect of boron carbide filler on the curing and mechanical properties of an epoxy resin. J Adhesion. 2009;85(4–5):216–38.10.1080/00218460902881782Suche in Google Scholar
9. Abenojar J, Martínez MA, Velascol F. Effect of moisture and temperature on the mechanical properties of an epoxy reinforced with boron carbide. J Adhes Sci Technol. 2011;25(18):2445–60.10.1163/016942411X580135Suche in Google Scholar
10. Abenojar J, Martínez MA, Velascol F, Pantoja M, Velasco F, Del Real JC. Epoxy composite reinforced with nano and micro SiC particles: curing kinetics and mechanical properties. J Adhesion. 2012;88(4–6):418–34.10.1080/00218464.2012.660396Suche in Google Scholar
11. Pantoja M, Díaz-Benito B, Velasco F, Abenojar J, De-real JC. Analysis of hydrolysis process of γ-methacryloxypropyltrimethoxysilane and its influence on the formation of silane coatings on 6063 aluminum alloy. Appl Surf Sci. 2009;255(12):6386–90.10.1016/j.apsusc.2009.02.022Suche in Google Scholar
12. Puspakanth S, Srinivasan B, Sreedhar B, Sastry TP. An in situ approach to prepare nanorods of titania–hydroxyapatite (TiO2–HAp) nanocomposite by microwave hydrothermal technique. Mater Chem Phys. 2008;107:492–8.10.1016/j.matchemphys.2007.08.029Suche in Google Scholar
13. Nath S, Biswas K, Basu B. Phase stability and microstructure development in hydroxyapatite–mullite system. Scr Mater. 2008;58:1054–57.10.1016/j.scriptamat.2008.01.045Suche in Google Scholar
14. Xihua Z, Changxia L, Musen L, Yunqiang B, Junglong S. Fabrication of hydroxyapatite/diopside/alumina composites by hot-press sintering process. Ceram Int. 2009;35:1969–73.10.1016/j.ceramint.2008.10.027Suche in Google Scholar
15. Miao X, Hu Y, Liu J, Haung X. Hydroxyapatite coating on porous zirconia. Mater Sci Eng C. 2007;27:257–61.10.1016/j.msec.2006.03.009Suche in Google Scholar
16. Curran DJ, Fleming TJ, Towler MR, Hampshire S. Mechanical parameters of strontium doped hydroxyapatite sintered using microwave and conventional methods. J Mech Behav Biomed Mater. 2011;4:2063–73.10.1016/j.jmbbm.2011.07.005Suche in Google Scholar
17. Prokopiev O, Sevostianov I. Dependence of the mechanical properties of sintered hydroxyapatite on the sintering temperature. Mat Sci Eng A. 2006;431:218–27.10.1016/j.msea.2006.05.158Suche in Google Scholar
18. He L, Standard OC, Haung TTY, Latella BA, Swain MV. Mechanical behaviour of porous Hydroxyapatite. Acta Biomater. 2008;4:577–86.10.1016/j.actbio.2007.11.002Suche in Google Scholar
19. Zyman Z, Ivanov I, Rochmistrov D, Glushko V, Tkachenko N, Kijko S. Sintering pecularities for hydroxyapatite with different degree of crystallinity. J Biomed Mater Res A. 2001;54:256–63.10.1002/1097-4636(200102)54:2<256::AID-JBM13>3.0.CO;2-BSuche in Google Scholar
20. Mobhsherpour I, Hashjin MS, Toosi SSR, Kamachali RD. Effect of the addition ZrO2 – Al2O3 on nanocrystalline hydroxyapatite bending strength and fracture toughness. Ceram Int. 2009;35:1569–74.10.1016/j.ceramint.2008.08.017Suche in Google Scholar
21. Blumer L, Schmidli F, Weiger R, Fischer J. A systematic approach to standardize artificial aging of resin composite cements. Dent Mater. 2015;31(7):855–63.10.1016/j.dental.2015.04.015Suche in Google Scholar
22. Torabinejad M, White TJ. Tooth filling material and use. US Patent Number 5,769,638.Suche in Google Scholar
23. White DJ, Lacefield WR, Chavers LS, Eleazer PD. The effect of three commonly used endodontic materials on the strength and hardness of root dentin. J Endod. 2002;28:828–30.10.1097/00004770-200212000-00008Suche in Google Scholar
24. Andreasen JO, Munksgaard EC, Bakland LK. Comparison of fracture resistance in root canals of immature sheep teeth after filling with calcium hydroxide or MTA. Dent Traumatol. 2006;22:154–6.10.1111/j.1600-9657.2006.00419.xSuche in Google Scholar
25. Torabinejad M, Hong CU, McDonald F, Pitt Ford TR. Physical and chemical properties of a new root-end filling material. J Endod. 1995;21:349–53.10.1016/S0099-2399(06)80967-2Suche in Google Scholar
26. do Desterro Fde P, Sader MS, Soares GD, Vidigal GM Jr. Can inorganic bovine bone grafts present distinct properties? Braz Dent J. 2014;25(4):282–8.10.1590/0103-6440201300067Suche in Google Scholar
27. Chung K, Greener EH. Degree of conversion of seven visible light-cured posterior composites., J Oral Rehabil. 1988;15(6):555–60.10.1111/j.1365-2842.1988.tb00192.xSuche in Google Scholar
28. Eliades G, Watts DC, Silikas N. Light intensity effects on resin-composite degree of conversion and shrinkage strain. Dent Mater. 2000;16(4):292–6.10.1016/S0109-5641(00)00020-8Suche in Google Scholar
29. Ylmen R, Jäglid U, Steenari BM, Panas I. Early hydration and setting of Portland cement monitored by IR, SEM and Vicat techniques. Cem Conc Res. 2009;39:433–9.10.1016/j.cemconres.2009.01.017Suche in Google Scholar
30. Ylmen R, Wadsö L, Panas I. Insights into early hydration of Portland limestone cement from infrared spectroscopy and isothermal calorimetry. Cem Conc Res. 2010;40:1541–6.10.1016/j.cemconres.2010.06.008Suche in Google Scholar
31. Mollah MYA, Kesmez M, Cocke DL. An X-ray diffraction (XRD) and Fourier transform infrared spectroscopic (FT-IR) investigation of the long-term effect on the solidification/stabilization (S/S) of arsenic(V) in Portland cement type-V. Sci Total Envir. 2004;325(1–3):255–62.10.1016/j.scitotenv.2003.09.012Suche in Google Scholar
32. Mollah MYA, Yu W, Schennach R, Cocke DL. A Fourier transform infrared spectroscopic investigation of the early hydration of Portland cement and the influence of sodium lignosulfonate. Cem Concr Res. 2000;30:267–73.10.1016/S0008-8846(99)00243-4Suche in Google Scholar
33. Soderholm KJ, Roberts MJ. Influence of water exposure on the tensile strength of composites. J Dent Res. 1990;69:1812–6.10.1177/00220345900690120501Suche in Google Scholar PubMed
34. Ferracane JL. Resin composite-state of the art. Dent Mater. 2011;27:29–38.10.1016/j.dental.2010.10.020Suche in Google Scholar
35. McCabe JF, Walls AWG. Applied dental materials. Oxford: Blackwell Publishing; 2008.Suche in Google Scholar
36. Rodrigues DS, Buciumeanu M, Martinelli AE, Nascimento RM, Henriques B, Silva FS, Souza JCM. Mechanical strength and wear of dental glass-ionomer and resin composites affected by porosity and chemical composition. J Bio Tribo Corros. 2015;1:24.10.1007/s40735-015-0025-9Suche in Google Scholar
37. Filis K, Filis Y. The weight change of various light-cured restorative materials stored in water. J Contemp Dent Pract. 2005;6(2):72–9.10.5005/jcdp-6-2-72Suche in Google Scholar
38. Fan PL, Edahl A, Leung RL, Stanford JW. Alternative interpretations of water sorption values of composite resins. J Dent Res. 1985;64:78–80.10.1177/00220345850640011601Suche in Google Scholar
39. Oysaed H, Ruyter IE. Water sorption and filler characteristics of composites for use in posterior teeth. J Dent Res. 1986;65(11):1315–8.10.1177/00220345860650110601Suche in Google Scholar
40. Hirasawa T, Hirano S, Hirabayashi S, Harashima I, Aizawa M. Initial dimensional change of composites in dry and wet conditions. J Dent Res. 1983;62(1):28–31.10.1177/00220345830620010701Suche in Google Scholar
41. Momoi Y, McCabe JF. Hygroscopic expansion of resin based composites during 6 months of water storage. Br Dent J. 1994;176:91–6.10.1038/sj.bdj.4808379Suche in Google Scholar
42. Bentz DP. Three-dimensional computer simulation of Portland cement hydration and microstructure development. J Am Ceram Soc. 1997;80:3–21.10.1111/j.1151-2916.1997.tb02785.xSuche in Google Scholar
43. Kemal E, Feza K, Nesrin H, Turk J. Mechanical and thermal. Properties of hydroxyapatite-impregnated bone cement. Med Sci. 2000;30:543–9.Suche in Google Scholar
44. Craig RG, Peyton FA. Elastic and mechanical properties of human dentin. J Dent Res. 1958;37:710–8.10.1177/00220345580370041801Suche in Google Scholar
45. Saber-Sheik K., Clarke RL, Braden M. Viscoelastic properties of some soft lining materials. I- effect of temperature. Biomaterials 1999;20:817–22.10.1016/S0142-9612(98)00236-1Suche in Google Scholar
©2017 Walter de Gruyter GmbH, Berlin/Boston
This article is distributed under the terms of the Creative Commons Attribution Non-Commercial License, which permits unrestricted non-commercial use, distribution, and reproduction in any medium, provided the original work is properly cited.
Artikel in diesem Heft
- Frontmatter
- In this Issue
- Full length articles
- Ultralight sponges of poly(para-xylylene) by template-assisted chemical vapour deposition
- Cryostructuring of polymer systems. 44. Freeze-dried and then chemically cross-linked wide porous cryostructurates based on serum albumin
- Macroporous polymer beads derived from a novel coporogen of polyethylene/dichlorobenzene
- Gas separation properties of Troeger’s base-bridged polyamides
- Catalytic crosslinking of a regenerated hydrophobic benzylated cellulose and nano TiO2 composite for enhanced oil absorbency
- On orientation memory in high density polyethylene – carbon nanofibers composites
- Comparative investigation of physical, mechanical and thermomechanical characterization of dental composite filled with nanohydroxyapatite and mineral trioxide aggregate
- Dissipative particle dynamics simulation on the self-assembly of linear ABC triblock copolymers under rigid spherical confinements
- Synthesis and characterization of cellulose acetate naphthoate with good ultraviolet and chemical resistance
- Thermal characterization and flammability of polypropylene containing sepiolite-APP combinations