A Bias in the Evaluation of Bias Comparing Randomized Trials with Nonexperimental Studies
-
 ,
,

Abstract
In a recent BMJ article, the authors conducted a meta-analysis to compare estimated treatment effects from randomized trials with those derived from observational studies based on routinely collected data (RCD). They calculated a pooled relative odds ratio (ROR) of 1.31 (95 % confidence interval [CI]: 1.03–1.65) and concluded that RCD studies systematically over-estimated protective effects. However, their meta-analysis inverted results for some clinical questions to force all estimates from RCD to be below 1. We evaluated the statistical properties of this pooled ROR, and found that the selective inversion rule employed in the original meta-analysis can positively bias the estimate of the ROR. We then repeated the random effects meta-analysis using a different inversion rule and found an estimated ROR of 0.98 (0.78–1.23), indicating the ROR is highly dependent on the direction of comparisons. As an alternative to the ROR, we calculated the observed proportion of clinical questions where the RCD and trial CIs overlap, as well as the expected proportion assuming no systematic difference between the studies. Out of 16 clinical questions, 50 % CIs overlapped for 8 (50 %; 25 to 75 %) compared with an expected overlap of 60 % assuming no systematic difference between RCD studies and trials. Thus, there was little evidence of a systematic difference in effect estimates between RCD and RCTs. Estimates of pooled RORs across distinct clinical questions are generally not interpretable and may be misleading.
1 Introduction
Routinely collected data (RCD), such as health insurance claims and electronic health records (EHRs), have become increasingly popular as data sources for studies of the comparative effectiveness and safety of treatments as used in routine care. (Schneeweiss and Avorn 2005) For many clinical questions, randomized controlled trials (RCTs) are unlikely to be conducted, leaving RCD as a primary source of evidence capable of informing clinical decision-making. (Black 1996) Because the treatments in RCD have not been randomly allocated to patients, these studies are subject to confounding bias, a problem that is limited in RCTs, where random assignment of treatments ensures estimates are unbiased on average. (Rothman et al. 2008) Although methods exist to control for confounding in study design and data analysis, the existence of unmeasured confounding variables as well as data errors in variables that are measured could theoretically result in residual bias in studies from RCD.
Several studies have attempted to evaluate the agreement of estimated treatment effects between observational data and RCTs through estimation of the relative odds ratio (ROR), defined as the estimated odds ratio (OR) from RCT data divided by the estimated OR from observational data. (Hemkens et al. 2016; Anglemyer et al. 2014). In a recent meta-analysis by Hemkens et al. (Hemkens et al. 2016), the authors compared published RCD studies and subsequent RCTs using the ROR, but inverted the clinical question and corresponding treatment effect estimates for all study questions where the RCD estimate was > 1, thereby ensuring that all RCD estimates indicated protective effects. They found a meta-analytic ROR of 1.31 (95 % confidence interval [CI]: 1.03–1.65) across 16 distinct clinical questions, from which they inferred that RCD studies “systematically and substantially overestimated the mortality benefits of medical treatments compared to subsequent trials”. However, this estimate of bias is itself biased.
In this paper, we explain how the pooled ROR estimate was biased as a result of selectively inverting the direction of the clinical questions under study. We then discuss problems in interpretation of the pooled ROR, even in the absence of inversion of some study results. Finally, we illustrate an alternative approach to evaluating the agreement between RCTs and observational studies based on the overlap in CIs between study types, and we use it to reanalyze the data of Hemkens et al. We also apply both approaches to the RCT data alone in order to compare the agreement among RCTs on the same clinical question.
2 Bias resulting from selective odds ratio inversion
Hemkens et al. extracted estimates of treatment effect from 16 RCD studies that utilized propensity scores to adjust for confounding and reported the comparative effect of interventions on mortality. They then compared these estimated effects with estimated effects from one or more RCTs that investigated the same clinical question and were published after the corresponding RCD study. In total, they included 36 RCTs. (Hemkens et al. 2016) When there was more than one available RCT for a given clinical question, the several RCT estimates were pooled to obtain a single RCT estimate for each study question. The pooled RCT estimate divided by the RCD estimate provided the ROR for each clinical question. These RORs were then combined in a final meta-analysis to obtain a single ROR across all clinical questions. According to Hemkens et al., an overall ROR near 1 would indicate good agreement between the RCD and RCT estimates, while values that departed from 1 would indicate poor agreement.
To understand the difficulty with this interpretation, assume that there is no systematic bias in the RCD studies and that the RCD and RCTs are estimating the same treatment effect parameter. In this case, if we have one RCD estimate and one RCT estimate for a given clinical question, sometimes the RCT estimate will be greater than the RCD estimate (ROR > 1), sometimes the reverse (ROR < 1), but on average across many RCD-RCT pairs, there would be no systematic difference between the RCD and the RCT, yielding a meta-analytic ROR of approximately 1. However, this property does not hold when the ORs for some RCD-RCT pairs are inverted, as they were in the analysis of Hemkens et al.
For all study questions where the RCD OR was greater than 1, Hemkens et al. inverted the clinical question and the OR value so that if the original OR estimate compared treatment A with treatment B, the new inverted OR (calculated as 1/OR) compared treatment B with treatment A, where either treatment could refer to a “control” treatment or no treatment. Corresponding RCT estimates were also inverted to ensure the direction of comparison matched that of the RCD estimates. This inversion causes the ROR for the associated clinical question also to be inverted, as seen in the equation:
where
For example, as shown in Figure 1, if the expected value of the OR is 1 for both the RCD and RCT studies, then
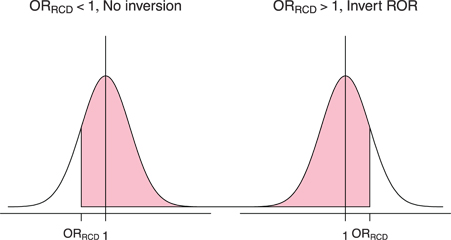
A hypothetical distribution for the ORRCT centered at a true value of 1. The shaded area represents the probability, after implementing the inversion rule, that ORRCT > ORRCD, which implies ROR > 1. Note that when the ROR is not inverted (ORRCD < 1), it is more likely that ROR > 1. When the ROR is inverted (ORRCD > 1), it is more likely that ROR < 1, which means after inversion, ROR is likely > 1.
3 Estimating the ROR without inversion
Given the problems created by selectively inverting some clinical questions, one could instead pursue estimation of the pooled ROR without inversion, simply using the OR estimates as they originally appeared in the RCD studies. However, the pooled ROR is still a flawed metric even without inversion, since it is entirely dependent on the direction of the comparisons under study, and in studies of two active treatments, the direction is arbitrary, depending on which treatment is chosen as the referent. For example, one clinical question included in the review of Hemkens et al. compared coronary artery bypass grafting (CABG) to placement of a drug eluting stent, and the associated ROR was 2.08, indicating over-estimation of the relative effect. (Wu et al. 2008) However, if the authors had instead reported drug eluting stent versus CABG, the ROR would instead be 0.48, indicating under-estimation of the effect. Since each of the clinical questions included in the analysis of Hemkens et al. could have been reported in either direction, there is a wide range of potential outcomes. Thus, there would be no reasonable basis for combining results across different, unrelated clinical questions.
To demonstrate the dependence of the estimated ROR on the direction of the comparisons under study, we extracted the number of patients and deaths in each treatment arm from each study reported in the Hemkens et al. paper and reproduced their meta-analysis, which inverted study questions whenever the RCD OR > 1 (Figure 2). We then inverted clinical questions whenever the RCT OR > 1, and applied the same meta-analysis model to these newly inverted data. This method results in a pooled ROR of 0.98 [0.78 to 1.23] (Figure 3). We also evaluated the most extreme results possible within these data, inverting to achieve either ROR > 1 or ROR < 1 for all clinical questions, yielding pooled ROR values of 1.47 (1.16–1.85) and 0.68 (0.54–0.86), respectively. Thus, many conclusions regarding bias are possible, depending simply on the direction of reported results.

Original analysis (reproduced from Hemkens et al.) of treatment effects on mortality in RCD studies and RCTs. The left panel shows the comparative effect of medical interventions on mortality reported in RCD studies and results of subsequently published trials on the same treatment comparisons. The right panel shows for each clinical question the relative odds ratio reported in trials versus the corresponding RCD study. Effect estimates are presented when inverting ORs whenever the RCD OR > 1.
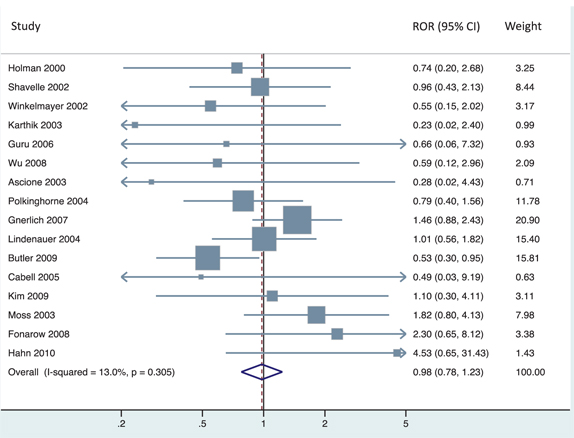
Re-analysis of treatment effects on mortality in RCD studies and RCTs. For each clinical question, we present the relative odds ratio reported in trial evidence versus the corresponding RCD study. Effect estimates are presented when inverting treatment groups and ORs whenever the RCT OR > 1.
Furthermore, even in cases where there is a clear directionality of comparison for all study questions, such as active treatment versus control, interpretation of the ROR is difficult. A single ROR value greater than 1 may be the result of 3 distinct possibilities: (1) the RCT evidence indicates that the intervention is harmful (OR > 1), and the observational study indicates that it is protective (OR < 1); (2) both types of study indicate that the intervention is harmful (OR > 1), and the RCT estimate is larger in magnitude; or (3) both types of study indicate that the intervention is protective (OR < 1), and the RCT estimate is smaller in magnitude. When RORs addressing different clinical questions are combined, these different possibilities become blended in the summary result, thwarting a sensible interpretation.
Interpretation of the ROR also depends on the assumption that bias operates in the same direction for all studies, which may be unlikely in most scenarios. For example, patients nearing the end of life may be more likely to get some treatments, such as rescue procedures, but less likely to receive preventive therapy, such as statins. (Glynn et al. 2001, 2006) Since end of life status is often not captured in RCD, this important predictor of mortality could bias observational study results in either direction, depending on the study. Similarly, RCTs can be biased in either direction, resulting in increases or decreases in the distance between the observational and randomized estimates.
Finally, in cohort studies it is preferable to estimate a risk ratio rather than an OR. (Knol et al. 2012) Although many scientists analyzing cohort studies report OR, perhaps because of the popularity of logistic regression, it is not the best metric on which to base an evaluation of study biases.
4 Confidence interval overlap
In addition to the meta-analytic ROR, Hemkens et al. also reported the proportion of clinical questions where the 95 % CIs overlapped between the RCD study and the pooled RCTs. This metric has some appeal because it does not depend on the direction of comparison in the clinical question under study. However, this proportion must be compared with the expected proportion overlapping if there is no systematic difference between the RCD and RCT studies. It is also more informative to use a shorter confidence interval in this exercise, since two 95 % confidence intervals will almost always overlap even when there are slight differences in the true risks. Thus, we calculated the observed proportion of clinical questions with overlapping CIs at the 25 %, 50 %, 75 %, and 95 % levels, along with a 95 % CI for this proportion. We also calculated the expected proportion of overlap for each confidence level under the assumption that there was no difference in the expected value between the RCD and RCT studies. Because the expected proportion depends on the standard error of each study, we calculated it separately for each RCD/RCT pair, as described in Schenker and Gentleman (2001), and then averaged across the clinical questions to calculate the overall expected proportion. Code and data for reproducing this analysis is given in Supplement C.
The 95 % CIs from the RCD studies overlapped the 95 % CIs for the pooled RCT estimates for all 16 clinical questions (100 %; 95 % CI: 79–100 %) (Table 1). This agrees with the expected 98 % proportion of overlap when there is no bias in the RCD studies. Agreement between observed and expected overlap was good for other confidence levels as well. For example, the 50 % CIs overlapped for 8 questions (50 %; 25–75 %), which is close to the expected 60 % overlap.
Observed and expected percent overlap of confidence intervals comparing the RCD/first RCT study and subsequent RCTs.
| Confidence level | RCD vs RCTs | First RCT vs others | ||
|---|---|---|---|---|
| Observed | Expected | Observed | Expected | |
| 25 | 19 (4, 46) | 31 | 25 (5, 57) | 33 |
| 50 | 50 (25, 75) | 60 | 67 (35, 90) | 63 |
| 75 | 81 (54, 96) | 84 | 100 (74, 100) | 87 |
| 95 | 100 (79, 100) | 98 | 100 (74, 100) | 99 |
5 Agreement among randomized trials
To further illustrate the bias in the inversion method, we used that method and the data of Hemkens et al. to compare agreement between the first randomized trial for a clinical question with the remainder of trials reporting on the same question. The first RCT to be published for a clinical question was thus substituted for the RCD study in the primary analysis. Subsequent RCTs were pooled and used to validate the findings of the index RCT. If a clinical question had only one RCT published, meaning there were no later trials to use for comparison, it was dropped from this analysis, leaving a total of 12 clinical questions and 32 randomized trials. We then applied both the method of Hemkens et al. and the CI overlap approach described above. When applying the Hemkens et al. approach, we inverted the direction of comparison whenever the first RCT OR was > 1. We then calculated the ROR for each clinical question, comparing the pooled RCT OR to the first RCT OR, and combined the ROR across clinical questions using meta-analysis.
When inverting estimates based on the OR from the first RCT, the pooled ROR is 1.46 (0.97–2.18) (Figure 4), again indicating strong positive bias, based on the interpretation provided in the Hemkens et al. paper. This bias likely stems from the method used, however, since the comparison is between one randomized trial and other randomized trials of the same question. In contrast, the 50 % CIs overlapped for 8 clinical questions (67 %; 35–90 %), compared with the expected overlap of 63 %. Again, results using other confidence levels gave similar results.
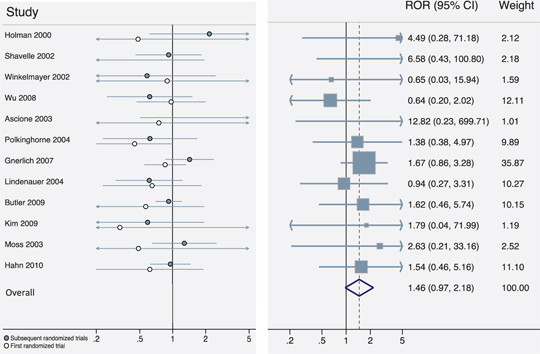
Agreement among randomized trials on the same clinical question. The left panel shows the comparative effect of medical interventions on mortality reported in the first RCT for a given clinical question and results of subsequently published trials on the same treatment comparisons. Labels refer to the original RCD study for each clinical question (to be comparable with earlier figures). The right panel shows the ROR reported in subsequent clinical trials versus the first trial for each clinical question. Effect estimates are presented when inverting treatment groups and ORs whenever the first RCT OR > 1.
6 Discussion
In this paper, we found that the previously published meta-analysis comparing estimates of treatment effect from RCTs versus RCD was flawed, creating positive bias in the pooled estimate of the ROR. Moreover, we demonstrated that the estimated ROR is highly dependent on the direction of comparisons under study, making it an unreliable measure of the agreement between treatment effect estimates when combining across multiple clinical questions, each of which could be inverted. When using a more appropriate analysis that does not depend on the direction of comparisons, we found that agreement between RCT and RCD estimates was similar to what would be expected if there were no bias in the RCD studies. In general, there was no evidence of systematic bias in the estimation of mortality effects from RCD studies.
Hemkens et al. have created an excellent and valuable data set for evaluating the scientific reliability of routinely collected health data with propensity score adjustment. It is a particular strength that only RCD studies conducted before the corresponding randomized trials were included, so that RCD results could not have been influenced by previous trial results. Unfortunately, a simple but fatal flaw in the statistical method invalidated their conclusions. Our re-analysis has shown that there is no more divergence between the results from the propensity score adjusted RCD studies versus the subsequent RCTs than what one would expect by chance in the absence of systematic bias. While there may be bias in some or all of the studies derived from RCD, this bias appears to be minor compared with the uncertainty due to the randomness that is inherent in the effect estimates from the RCTs. In addition, some or all of the RCTs may have bias as well, increasing the probability of discrepancies between the studies.
Despite the thorough literature review, this dataset does have some limitations. First, the studies chosen cover only a very small fraction of all published studies of treatment effects estimated from RCD. Online responses to the paper of Hemkens et al. have pointed out additional criticisms of the underlying data. For example, Suissa noted that several of the RCD studies included in the review were subject to immortal time bias, an important design flaw that can cause severe bias. (Suissa 2016) Hankins et al. further note that RCD studies estimate effects in populations that are often very different from the highly restrictive populations included in RCTs. (Hankins et al. 2016) Finally, an important obstacle to drawing an inference about the differences between estimates of treatment effect from RCTs versus RCD from this study is the low precision attached to the estimates of nearly all the clinical questions that were included. The most precisely estimated question-specific ROR still had a CI that extended from 0.88 to 2.43, covering a wide range of possible conclusions about the relative estimation from RCTs versus RCD for that question.
In an important 2005 paper, Ioannidis argued that limited study size is one of six reasons why “most published research findings are false”. (Ioannidis 2005) An advantage of RCD is the ability to greatly increase study size without breaking the bank. This scenario leads to a trade-off between what is typically a higher risk of bias in RCD versus wider CIs in RCTs. To understand better the nature and magnitude of this trade-off, Hemkens’ data set should be augmented either with more RCD/RCT pairs or with RCTs that are much larger.
With the recent focus on comparative effectiveness research, many studies compare one active treatment with another. (Dreyer et al. 2010; Sullivan and Goldmann 2011; Goldberg et al. 2011) Thus, finding that observational studies over-estimate the comparative effect of treatment A to treatment B is the same as finding that they underestimate the comparative effect of treatment B to treatment A, and the direction of the ROR will vary accordingly. Therefore, a meta-analytic ROR that combines information across many clinical questions, each of which could be inverted, cannot inform the potential direction of bias in any given RCD study. Although we focused on the overlap in CIs as an alternative analysis, some of the other metrics reported by Hemkens et al. could also be modified to compare more explicitly the observed agreement with what would be expected under the hypothesis of no bias. For example, the proportion of clinical questions with a RCD effect CI that includes the pooled effect estimate from subsequent trials (44 %) could be compared with the relevant expected proportion (52 %), which accounts for the substantial imprecision in the RCT estimates under study (see Supplement B for additional calculations).
The binary nature of the CI overlap approach may inadvertently lead investigators to use it as a hypothesis test of differences, which we do not recommend. A better approach to assessment of differences would be to estimate the average magnitude of the difference between observational studies and RCTs (regardless of the direction of the distances), accounting for the substantial variation in studies. However, this approach requires additional development.
Prior meta-analyses comparing randomized and observational evidence on treatment effects have also used the ROR to quantify the agreement between study types. A Cochrane review identified 14 such studies, of which 11 were reported to have found no difference (based on statistical significance) between the RCT and observational estimates. (Anglemyer et al. 2014) Of the 3 studies that were described as finding a difference, 2 indicated lower estimates from observational studies (Bhandari et al. 2004; Beynon et al. 2008) and 1 indicated higher estimates from observational studies. (Furlan et al. 2008) None of the studies included in the review appeared to employ the selective inversion rule used by Hemkens et al., but their use of the ROR to quantify bias is just as flawed and dependent on the direction of comparison chosen for each study by investigators. In addition, several of the earliest papers comparing observational studies and RCTs used simple graphical displays without any quantitative assessment of differences. (Concato et al. 2000; Benson and Hartz 2000; Schulz et al. 1995).
7 Conclusion
Routine collection of health data for the purposes of observational medical research is increasing, and databases are growing in terms of the number of patients and the amount and type of available information. (Schneeweiss and Avorn 2005; Benchimol et al. 2015; De Lusignan and Van Weel 2006; Powell et al. 2003) Based on the results of this study, the claims that RCD studies are especially unreliable and should be viewed skeptically are unwarranted. This is an important issue, as RCD can provide evidence on a wide variety of clinical questions and patient populations for which there are no randomized trials.
Contributors
JMF and KJR conceived of the study. JMF and SD extracted data and performed statistical analysis. JMF drafted the manuscript and web appendix, and all authors made revisions. All authors read and approved the final version of the manuscript. JMF is the guarantor.
Funding: This study was internally funded by the Division of Pharmacoepidemiology and Pharmacoeconomics at Brigham and Women’s Hospital.
Krista Huybrechts is supported by a career development grant K01MH099141 from the National Institute of Mental Health. Shirley Wang is supported by grant number R00HS022193 from the Agency for Healthcare Research and Quality.
Competing interests: No competing interests.
Ethical approval: This study does not require IRB approval.
References
Anglemyer, A., Horvath, H. T., and Bero, L. (2014). Healthcare outcomes assessed with observational study designs compared with those assessed in randomized trials. In Cochrane Database of Systematic Reviews, The Cochrane Collaboration (ed.). Chichester, UK: John Wiley & Sons, Ltd. http://doi.wiley.com/10.1002/14651858.MR000034.pub2. (Accessed May 12, 2016).10.1002/14651858.MR000034.pub2Search in Google Scholar
Benchimol, E. I., Smeeth, L., Guttmann, A., et al. (2015). The REporting of studies Conducted using Observational Routinely-collected health Data (RECORD) statement. Plos Medicine, 12(10):e1001885.10.1371/journal.pmed.1001885Search in Google Scholar PubMed PubMed Central
Benson, K., and Hartz, A. J. (2000). A comparison of observational studies and randomized, controlled trials. The New England Journal of Medicine, 342(25):1878–1886.10.1056/NEJM200006223422506Search in Google Scholar PubMed
Beynon, R., Harris, R., and Sterne, J. 2008. The quantification of bias in randomised and non-randomised studies: The BRANDO NRS Study [poster]. 16th Cochrane Colloquium. Freiburg im Breisgau, Germany.Search in Google Scholar
Bhandari, M., Tornetta III, P., Ellis, T., et al. (2004). Hierarchy of evidence: Differences in results between non-randomized studies and randomized trials in patients with femoral neck fractures. Archives Orthopedic Trauma Surgery, 124(1):10–16.10.1007/s00402-003-0559-zSearch in Google Scholar PubMed
Black, N. (1996). Why we need observational studies to evaluate the effectiveness of health care. BMJ, 312(7040):1215.10.1136/bmj.312.7040.1215Search in Google Scholar PubMed PubMed Central
Concato, J., Shah, N., and Horwitz, R. I. (2000). Randomized, controlled trials, observational studies, and the hierarchy of research designs. The New England Journal of Medicine, 342(25):1887–1892.10.1056/NEJM200006223422507Search in Google Scholar PubMed PubMed Central
De Lusignan, S., and Van Weel, C. (2006). The use of routinely collected computer data for research in primary care: Opportunities and challenges. Family Practical, 23(2):253–263.10.1093/fampra/cmi106Search in Google Scholar PubMed
Dreyer, N. A., Tunis, S. R., Berger, M., et al. (2010). Why observational studies should be among the tools used in comparative effectiveness research. Health Affairs (Millwood), 29(10):1818–1825.10.1377/hlthaff.2010.0666Search in Google Scholar PubMed
Furlan, A. D., Tomlinson, G., Jadad, A. A. R., et al. (2008). Examining heterogeneity in meta-analysis: Comparing results of randomized trials and nonrandomized studies of interventions for low back pain. Spine, 33(3):339–348.10.1097/BRS.0b013e31816233b5Search in Google Scholar PubMed
Glynn, R., Schneeweiss, S., Wang, P., et al. (2006). Selective prescribing led to overestimation of the benefits of lipid-lowering drugs. Journal Clinical Epidemiology, 59(8):819–828.10.1016/j.jclinepi.2005.12.012Search in Google Scholar PubMed
Glynn, R. J., Knight, E. L., Levin, R., et al. (2001). Paradoxical relations of drug treatment with mortality in older persons. Epidemiology, 12(6):682–689.10.1097/00001648-200111000-00017Search in Google Scholar PubMed
Goldberg, N. H., Schneeweiss, S., Kowal, M. K., et al. (2011). Availability of comparative efficacy data at the time of drug approval in the United States. JAMA, 305(17):1786–1789.10.1001/jama.2011.539Search in Google Scholar PubMed
Hankins, M. C., Buysse, B., Chatzitheofilou, I., et al. (2016). Re: Agreement of treatment effects for mortality from routinely collected data and subsequent randomized trials: meta-epidemiological survey. The BMJ, http://www.bmj.com/content/352/bmj.i493/rr-1. (Accessed May 17, 2016).Search in Google Scholar
Hemkens, L. G., Contopoulos-Ioannidis, D. G., and Ioannidis, J. P. A. (2016). Agreement of treatment effects for mortality from routinely collected data and subsequent randomized trials: Meta-epidemiological survey. BMJ, 352:i493.10.1136/bmj.i493Search in Google Scholar PubMed PubMed Central
Ioannidis, J. P. (2005). Why most published research findings are false. Plos Medicine, 2(8):e124.10.1371/journal.pmed.0020124Search in Google Scholar PubMed PubMed Central
Knol, M. J., Le Cessie, S., Algra, A., et al. (2012). Overestimation of risk ratios by odds ratios in trials and cohort studies: Alternatives to logistic regression. Canada Medica Association Journal, 184(8):895–899.10.1503/cmaj.101715Search in Google Scholar PubMed PubMed Central
Powell, A. E., Davies, H. T. O., and Thomson, R. G. (2003). Using routine comparative data to assess the quality of health care: Understanding and avoiding common pitfalls. Qualitative Safety Health Care, 12(2):122–128.10.1136/qhc.12.2.122Search in Google Scholar PubMed PubMed Central
Rothman, K. J., Greenland, S., and Lash, T. L. (2008). Modern Epidemiology. Lippincott Williams & Wilkins: Philadelphia, PA.Search in Google Scholar
Schenker, N., and Gentleman, J. F. (2001). On judging the significance of differences by examining the overlap between confidence intervals. American Statistical, 55(3):182–186.10.1198/000313001317097960Search in Google Scholar
Schneeweiss, S., and Avorn, J. (2005). A review of uses of health care utilization databases for epidemiologic research on therapeutics. Journal Clinical Epidemiology, 58(4):323–337.10.1016/j.jclinepi.2004.10.012Search in Google Scholar PubMed
Schulz, K. F., Chalmers, I., Hayes, R. J., et al. (1995). Empirical evidence of bias: Dimensions of methodological quality associated with estimates of treatment effects in controlled trials. JAMA, 273(5):408–412.10.1001/jama.1995.03520290060030Search in Google Scholar PubMed
Suissa, S. (2016). Re: Agreement of treatment effects for mortality from routinely collected data and subsequent randomized trials: Meta-epidemiological survey. The BMJ, http://www.bmj.com/content/352/bmj.i493/rr-3). (Accessed May 17, 2016).10.1136/bmj.i493Search in Google Scholar
Sullivan, P., and Goldmann, D. (2011). The promise of comparative effectiveness research. JAMA, 305(4):400–401.10.1001/jama.2011.12Search in Google Scholar PubMed
Wu, C., Hannan, E. L., Walford, G., et al. (2008). Utilization and outcomes of unprotected left main coronary artery stenting and coronary artery bypass graft surgery. The Annals of Thoracic Surgery, 86(4):1153–1159.10.1016/j.athoracsur.2008.05.059Search in Google Scholar PubMed
Supplemental Material
The online version of this article (DOI:https://doi.org/10.1515/em-2016-0018) offers supplementary material, available to authorized users.
© 2017 Walter de Gruyter GmbH, Berlin/Boston
Articles in the same Issue
- A Bias in the Evaluation of Bias Comparing Randomized Trials with Nonexperimental Studies
- Compartmental Model Diagrams as Causal Representations in Relation to DAGs
- Doubly Robust Estimator for Indirectly Standardized Mortality Ratios
- A General Framework for and New Normalization of Attributable Proportion