
Information overload: when less is more in medical imaging
-
James R. Duncan


Abstract
In medicine, data collection and analysis provide the information needed to reduce diagnostic uncertainty. An examination of how medical imaging data is collected and then transformed into diagnostic information provides testable ideas for better managing this dynamic process. In other fields, process data is systematically assessed for differences between observed and predicted values. For studies that expose patients to the potentially harmful effects of ionizing radiation, monitoring imaging studies/illness, images/imaging study and radiation exposure/image would be steps towards developing radiation dose budgets for the diagnosis and treatment of common conditions. Random variation within the expected range would signal a high quality process. Conversely, single outlying cases or nonrandom variation within the expected range would trigger an investigation for a possible underlying cause. Such investigations would provide insights into how to continually improve this important aspect of healthcare.
“Doubt is not a pleasant condition, but certainty is absurd” (Voltaire).
Everyone caring for patients is inundated with data. Our senses are overwhelmed by data emanating from bedside alarms, phone calls, diagnostic images and endless pages of electronic medical records [1]. To date little has been done to organize this torrent into a structured flow that caregivers can quickly grasp and follow over time with economy of effort. Other complex businesses are far more capable of transforming mountains of data into the nuggets of information. Medicine needs to catch up.
In his Mathematical Theory of Communication, Claude Shannon distinguished data from information. He defined information by its ability to reduce uncertainty [2, 3]. He recognized that while transmitting a longer message might require more characters, that extra data does not necessarily convey more information. “Abdominal pain in the periumbilical region” is redundant in the sense that the same diagnostic information could be conveyed by “periumbilical pain”. While such twofold reductions in data are often unnecessary, Shannon recognized that excess data can overwhelm communication systems when bandwidth is limited. Such bandwidth limitations are not restricted to electronic devices such as a tenuous wireless connection. They can arise when caregivers interact during medical emergencies. Bandwidth limitations also occur when the diagnosis and treatment of a patient with a particularly complex history needs to be communicated quickly and effectively.
Efforts to improve communication in medicine and better manage the flow of information will require a systematic approach. We should look upstream and ask, “What job do our customers hire our services and procedures to accomplish?” [4, 5]. In other words, what prompts patients to hire the healthcare system and open the flood gates? How does the diagnostic process in general and medical imaging in particular contribute to the torrential flow of information? How might that flow be better managed?
Patients seek help from the healthcare system when a condition exceeds their personal capacity for diagnosis and treatment (Figure 1). Consider Mike, a previously healthy teenager, who develops abdominal pain and malaise on a Saturday afternoon. At first he and his parents attribute the symptoms to a viral gastroenteritis or a dietary transgression. But by Monday, Mike feels worse and his parents are worried. They arrange a visit with his physician.
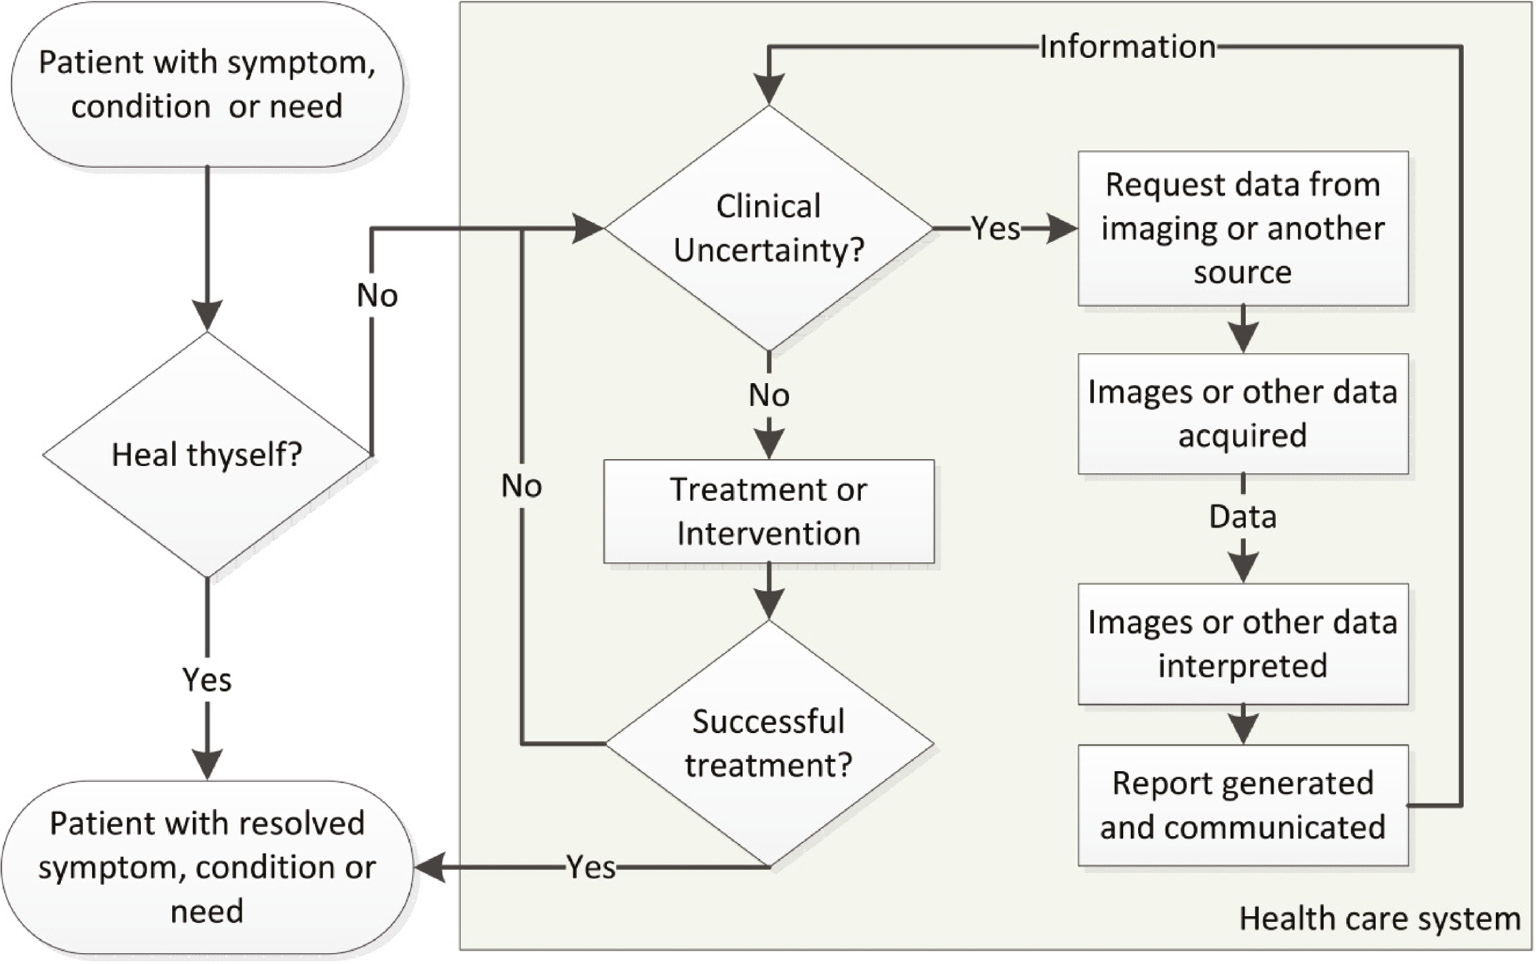
Flow chart illustrating the interplay between data collection, transformation and utility. In this model, clinical uncertainty is relative since treatments or interventions may begin once information reduces uncertainty below an acceptable level.
During diagnosis and treatment, uncertainty and failure lead to multiple cycles of data collection and analysis.
The physician office visit accelerates the flow of data. The family completes a questionnaire about symptoms and past medical history, vital signs are recorded, and the history and physical exam generate even more data.
While this data reduces the uncertainty surrounding Mike’s condition, uncertainty persists. Shannon realized that while the initial list of potential causes and possible treatments may be immense, it is finite. The context of Mike’s prior health and the prevalence of certain diseases markedly narrows the list. Data from the office visit shortens it further. The list soon focuses on gastroenteritis and appendicitis. Mike, his parents and his physician now face a decision: accept a presumptive diagnosis and start treatment, or pursue additional studies in hopes of further reducing uncertainty.
The two routes can be combined. Treatment can commence based on the presumptive diagnosis even though new data is continually being collected. Periodic reassessment of the data may confirm or refute the presumptive diagnosis with corresponding revisions to the treatment plan. A presumptive diagnosis of viral gastroenteritis suggests that Mike’s symptoms will follow a predictable time course. A presumptive diagnosis of early appendicitis will trigger referral to a surgeon and collection of additional lab and imaging data. The situations are dynamic. Analysis of the expanding time series of data can be used to improve the working diagnosis, and also shed light on the accuracy of the prior predictions. If Mike’s symptoms steadily worsen and/or new symptoms arise, this constitutes a deviation from the expected course for gastroenteritis. Conversely, if Mike’s symptoms completely resolve before the labs, imaging or surgical referral are completed, the diagnosis of appendicitis should be questioned. Even an ocean of information can not completely address every uncertainty, but this approach attempts to continually manage it.
By first outlining the expected course of data over time, a reference is created against which the observed data can be compared. In other fields, sequential data is systematically monitored in this way for differences between observed and predicted values. Control charts and other quality improvement tools use algorithms to analyze vast datasets. A single large deviation or nonrandom sequences of smaller deviations are informative and trigger an investigation for causes. While control charts are increasingly used in our institutional quality improvement programs [6], one can ask why these tools are not yet routinely used to analyze clinical data such as vital signs, labs, symptoms or radiation exposure.
Medical imaging is attractive because it rapidly captures and preserves vast amounts of data about the patient’s internal condition. While the uncertainty regarding the patient’s condition can also be addressed by other methods (history, physical, labs, direct inspection after surgical exposure, etc.), for many conditions, imaging is more informative and less invasive. While the sensor arrays in imaging equipment collect vast quantities of data that could be displayed as page after page of numerical values, imaging data is typically displayed in formats that leverage our visual system’s capacity to recognize and decode the patterns caused by illness or injury. Image interpretation transforms gigabytes of imaging data into kilobytes of diagnostic information that is then transmitted in a text report.
However, medical imaging’s ability to reduce diagnostic uncertainty is a double edged sword. Its benefits are accompanied by risks such as radiation exposure [7], incidental findings [8], and high costs [9]. Efforts can be made to optimize radiation exposure [10, 11] and to utilize imaging more effectively [12]. Radiation exposure provides an attractive improvement opportunity since it is relatively easy to measure and the risk of harm from cancer induction steadily rises with increasing exposure [13]. Computed tomography (CT), fluoroscopy, nuclear medicine studies and radiographs require passing high-energy photons through the patient. In many cases, more than 90% of these photons deposit their energy within the patient rather than the detector. Since the cumulative damage of this bombardment sums over a lifetime, the risk increases geometrically with studies per illness or condition, images per study and exposure per image.
Strategies that optimize information flow can also be used to manage radiation risk. We should leverage the same observed vs. expected data monitoring paradigm used for the diagnostic evaluation discussed above. Medical imaging reduces diagnostic uncertainty, but we should not be willing to trade each bit of new information about the diagnosis for new uncertainty regarding the patient’s radiation risk. Guidelines to determine the most appropriate study can help reduce exposure in the first place [14]. Then, if Mike’s condition does warrant imaging, we should try to predict his expected exposure and seek processes that reliably meet these expectations. Stated another way, we should set “radiation dose budgets” for the diagnosis and treatment of common conditions like abdominal pain (Table 1). While expected ranges of dose metrics for common studies are being established [16], meeting the promise of “less is more” will require an even more comprehensive and systematic approach. We need to consider dose/image (Figure 2), images/study and studies/illness. We also need to shift our frame of reference from image quality to image utility [18].
Example of a dose budget for abdominal pain in a pediatric patient.
| Metric | Observed result | Expected rangea | Units |
|---|---|---|---|
| CT studies/illnessb | 1 | 0–1 | CT Studies |
| Radiation exposure/CT study (DLP)c | 400 | 200–1200 | mGy-cm |
| Radiation exposure/image (CTDIvol)d | 6 | 3–20 | mGy |
aThe expected range in this example are based on the 25th–75th percentiles observed for adult abdomen/pelvis exams from 2010 to 2012 by Keegan et al. [11]. bCT studies per illness can be determined by number of billed procedures. The lower end of the expected range is set at 0 as the possibility of appendicitis can be ascertained by history/physical and/or ultrasound. cRadiation exposure/CT study is inferred from the dose length product (DLP). DLP is calculated by multiplying the average CTDIvol by the length of the CT scan(s) along the long axis of the patient [15]. It is related to the amount of X-ray energy absorbed by the patient during the CT scan. The lower end of this expected range reflects a limited exam of pelvis or abdomen. The upper end of the expect range reflects a single acquisition of the entire abdomen and pelvis. While much higher levels can be observed, they often result from multiple scans through the same region. For example, it is possible to repeatedly image the abdomen and pelvis, before, during and after administering intravenous contrast. However, only a single set of images is typically needed to diagnose appendicitis. dRadiation exposure/image is inferred from CT Dose Index (volume). This metric reflects the energy deposited in a tissue phantom when it is exposed using the same scanner settings used for the patient [15]. Higher values are typically seen when scanner settings are adjusted to image larger patients or acquire images with higher/signal to noise.
![Figure 2: Illustrating the nonlinear relationship between data and information.In Panel A, the iconic earthrise image acquired by the Apollo 8 crew is displayed at differing resolutions. When asked to name or “diagnose” the image, most viewers find the 75×75 pixel image sufficient even though the 300×300 pixel image clearly has superior image quality. This task obviously leverages prior experience with this well-known image. However the 18×18 pixel image would be sufficient, if the task was asking the Apollo 8 crew or their guidance computer to locate earth for the trip home. While this second task clearly contains a diagnostic component, the image’s role is now more analogous to how low dose images are used to guide fluoroscopic procedures. Low dose images can contain sufficient information to complete the task at hand, especially when the task builds upon experience with prior data or the answer lies within a limited solution space. Panel B illustrates the sigmoidal relationship between available data and ability to complete the task at hand. (Adapted from Duncan and Evens) [17].](/document/doi/10.1515/dx-2017-0008/asset/graphic/j_dx-2017-0008_fig_002.jpg)
Illustrating the nonlinear relationship between data and information.
In Panel A, the iconic earthrise image acquired by the Apollo 8 crew is displayed at differing resolutions. When asked to name or “diagnose” the image, most viewers find the 75×75 pixel image sufficient even though the 300×300 pixel image clearly has superior image quality. This task obviously leverages prior experience with this well-known image. However the 18×18 pixel image would be sufficient, if the task was asking the Apollo 8 crew or their guidance computer to locate earth for the trip home. While this second task clearly contains a diagnostic component, the image’s role is now more analogous to how low dose images are used to guide fluoroscopic procedures. Low dose images can contain sufficient information to complete the task at hand, especially when the task builds upon experience with prior data or the answer lies within a limited solution space. Panel B illustrates the sigmoidal relationship between available data and ability to complete the task at hand. (Adapted from Duncan and Evens) [17].
This observed vs. predicted format for radiation exposure has other advantages. Reducing unintended variation is the first step in improving quality and safety. Values outside the expected range warrant an investigation for the underlying cause. Establishing predicted values also creates a foundation for measuring improvement. In addition, conformance between prior predictions and observed results simplifies communication. Mike, his parents and his physician do not need to be experts in radiation dosimetry to interpret the results. Values within the expected range suggest a high quality process [19]. Finally, the expected range can become part of the risk vs. benefit conversation during shared decision making.
Patients’ overall care might be improved by strategies that replace, reduce or recycle information from imaging. Replacement strategies exploit instances where relatively small amounts of diagnostic data from non-imaging sources might reliably address clinical uncertainty. Reduction strategies combat the natural tendency to collect just one more bit of data and instead truncate collection as soon as there is sufficient information to make a valid treatment decision [17]. Recycling strategies leverage existing information such as prior imaging studies or other portions of the medical record to limit the differential diagnosis to be addressed by the new imaging study, possibly allowing for a more tailored or focused study.
Shannon demonstrated how prior predictions and feedback channels allow error-free communication. Shannon’s framework also suggests that the ebb and flow of requests for diagnostic information will reflect varying levels of uncertainty in the patient’s diagnosis or response to treatment. As such, the bandwidth devoted to requests for diagnostic information and transmission of results could become a tracking index of the patient’s current condition. Critically ill and unstable patients have more data flowing into and out of the electronic medical record. In much the same way that intelligence agencies gauge the terrorism threat by monitoring patterns of online chatter, a patient’s current condition could be gauged by monitoring the network activity devoted to that patient.
The success of our endeavors to manage information flow might be seen when Mike is asked numerous questions about his current condition and he repeatedly utters a single syllable, “fine”.
Acknowledgments
The author wishes to acknowledge and thank Steve Swensen, Jacqueline Saito, and Gary Becker for their helpful comments and suggestions.
Author contributions: The author has accepted responsibility for the entire content of this submitted manuscript and approved submission.
Research funding: None declared.
Employment or leadership: None declared.
Honorarium: None declared.
Competing interests: The funding organization(s) played no role in the study design; in the collection, analysis, and interpretation of data; in the writing of the report; or in the decision to submit the report for publication.
References
1. Wachter RM. The digital doctor: hope, hype, and harm at the dawn of medicine’s computer age. New York, NY: McGraw-Hill Education, 2015.Suche in Google Scholar
2. Shannon CE, Weaver W. The mathematical theory of communication. Urbana, IL: University of Illinois Press, 1949:117.Suche in Google Scholar
3. Pierce JR. An introduction to information theory: symbols, signals and noise, 2nd, rev. ed. New York: Dover Publications, 1980.Suche in Google Scholar
4. Christensen CM. The innovator’s dilemma: when new technologies cause great firms to fail. Boston, MA: Harvard Business School Press, 1997.Suche in Google Scholar
5. Deming WE. The new economics for industry, government, education, 2nd ed. Cambridge, MA: Massachusetts Institute of Technology, Center for Advanced Engineering Study, 1994.Suche in Google Scholar
6. Provost LP, Murray SK. The health care data guide: learning from data for improvement, 1st ed. San Francisco, CA: Jossey-Bass; 2011.Suche in Google Scholar
7. Smith-Bindman R, Miglioretti DL, Larson EB. Rising use of diagnostic medical imaging in a large integrated health system. Health Aff (Millwood) 2008;27:1491–502.10.1377/hlthaff.27.6.1491Suche in Google Scholar PubMed PubMed Central
8. Welch HG, Schwartz L, Woloshin S. Overdiagnosed: making people sick in the pursuit of health. Boston, MA: Beacon Press; 2011.Suche in Google Scholar
9. Iglehart JK. Health insurers and medical-imaging policy – a work in progress. N Engl J Med 2009;360:1030–7.10.1056/NEJMhpr0808703Suche in Google Scholar PubMed
10. Duncan JR, Balter S, Becker GJ, Brady J, Brink JA, Bulas D, et al. Optimizing radiation use during fluoroscopic procedures: proceedings from a multidisciplinary consensus panel. J Vasc Interv Radiol 2011;22:425–9.10.1016/j.jvir.2010.12.008Suche in Google Scholar PubMed
11. Keegan J, Miglioretti DL, Gould R, Donnelly LF, Wilson ND, Smith-Bindman R. Radiation dose metrics in CT: assessing dose using the National Quality Forum CT patient safety measure. J Am Coll Radiol 2014;11:309–15.10.1016/j.jacr.2013.10.009Suche in Google Scholar PubMed
12. Dunne RM, Ip IK, Abbett S, Gershanik EF, Raja AS, Hunsaker A, et al. Effect of evidence-based clinical decision support on the use and yield of CT pulmonary angiographic imaging in hospitalized patients. Radiology 2015;276:167–74.10.1148/radiol.15141208Suche in Google Scholar PubMed PubMed Central
13. National Research Council (U.S.). Committee to Assess Health Risks from Exposure to Low Level of Ionizing Radiation. Health risks from exposure to low levels of ionizing radiation: BEIR VII Phase 2. Washington, DC: National Academies Press, 2006.Suche in Google Scholar
14. Taylor AJ, Cerqueira M, Hodgson JM, Mark D, Min J, O’Gara P, et al. ACCF/SCCT/ACR/AHA/ASE/ASNC/NASCI/SCAI/SCMR 2010 Appropriate use criteria for cardiac computed tomography. A report of the American college of cardiology foundation appropriate use criteria task force, the society of cardiovascular computed tomography, the American college of radiology, the American heart association, the American society of echocardiography, the American society of nuclear cardiology, the North American society for cardiovascular imaging, the society for cardiovascular angiography and interventions, and the society for cardiovascular magnetic resonance. Circulation 2010;122:e525–55.10.1161/CIR.0b013e3181fcae66Suche in Google Scholar PubMed
15. Morin RL, Seibert JA, Boone JM. Radiation dose and safety: informatics standards and tools. J Am Coll Radiol 2014;11(12 Pt B):1286–97.10.1016/j.jacr.2014.09.017Suche in Google Scholar PubMed
16. Reference levels and achievable doses in medical and dental imaging: recommendations for the United States. Bethesda, MD: National Council on Radiation Protection and Measurements, 2012.Suche in Google Scholar
17. Duncan JR, Evens RG. Using information to optimize medical outcomes. J Am Med Assoc 2009;301:2383–5.10.1001/jama.2009.827Suche in Google Scholar PubMed
18. Tabriz D, Duncan J. Radiation exposure: optimizing image quality or image utility? J Patient Saf 2015. DOI: 10.1097/PTS.0000000000000158. Available at: http://journals.lww.com/journalpatientsafety. Accessed: 6/4/2017.10.1097/PTS.0000000000000158Suche in Google Scholar PubMed
19. Berwick DM. Controlling variation in health care: a consultation from Walter Shewhart. Med Care 1991;29:1212–25.10.1097/00005650-199112000-00004Suche in Google Scholar PubMed
©2017 Walter de Gruyter GmbH, Berlin/Boston
Artikel in diesem Heft
- Frontmatter
- Editorial
- Improving diagnosis in radiology – progress and proposals
- Reviews
- Improving diagnosis in health care: perspectives from the American College of Radiology
- The role of radiology in diagnostic error: a medical malpractice claims review
- Medical errors, malpractice, and defensive medicine: an ill-fated triad
- Perceptual errors in pediatric radiology
- 256 Shades of gray: uncertainty and diagnostic error in radiology
- Using Bayes’ rule in diagnostic testing: a graphical explanation
- X-ray art images: objects from nature
- Mini Review
- Assigning responsibility to close the loop on radiology test results
- Opinion Papers
- Information overload: when less is more in medical imaging
- Radiology education: a radiology curriculum for all medical students?
- Letter to the Editor
- Demonstration Collaborative project to reduce emergency department radiologic diagnostic errors