Uncertainty of the Export VAT Rebate Policy: Measurement and Its Effects
-
Yanzhe Zhang


Abstract
Based on the export VAT rebate rate data from 2004 to 2015, this paper measures the uncertainty of Chinese export VAT rebate policy by using unexpected fluctuation of export VAT rebate rate, and finds that the index varies across products, years and industries. Then, the paper studies the influence of the uncertainty of export VAT rebate policy on China’s export growth from both theoretical and empirical perspectives. The research results show that this uncertainty reduces the expected profit of export enterprises and their optimal output, and significantly reduces the growth rate of the ordinary export that applies the export VAT rebate method, but it has no impact on the processing export. By decomposing total value of exports, it is found that the growth in the number of ordinary export relationship and average sales decrease with the increase of uncertainty, while the average price growth rate increases slightly, and these effects are only reflected in the newly entered export relations. The findings suggest that when the uncertainty of export VAT rebate policy is high, enterprises are more cautious about entering the ordinary export market and more likely to adopt a low-quantity-high-price strategy.
1 Introduction
The export VAT rebate policy is an important tool for China’s macroeconomic regulation, therefore, the export VAT rebate rate is often adjusted. Especially in the current complex world economic background, policy adjustments are becoming more frequent. According to the statistics in this paper, from 2004 to 2020, the tax rebate rate or VAT rate was adjusted on average every three years for each 8-digit HS code product. Figure 1 shows the distribution of the probability of rebate rate and VAT rate (total) adjustments[1]. It should be noted that there are significant differences in the probability of rebate rate and VAT rate adjustments among different products or different years (Figure 2 and Figure 3)[2]. Frequent policy changes will cause uncertainty, which in turn affects enterprises’ production decisions. Pei (2008) pointed out that frequent adjustments in export VAT rebate policy are the result of the government’s “choice of timing” between fiscal burden and export growth, which is not conducive to establishing a stable and predictable institutional environment and thus interferes with business expectations. According to a survey conducted by Long (2009), more than 90% of enterprises believed that the export VAT rebate policy is crucial to them, and policy uncertainty may have seriously restricted the development of China’s export trade. In this context, this paper attempts to examine the following issues: Can the uncertainty of export VAT rebate policy (hereinafter referred to as export VAT rebate uncertainty) be quantified? What are the characteristics of its distribution? What impact does export VAT rebate uncertainty have on China’s export growth? How do economic agents adjust their decisions to cope with this uncertainty?

Probability Distribution of Tax Rebate Rate and VAT Rate Adjustment for 8-Digit HS Code Products
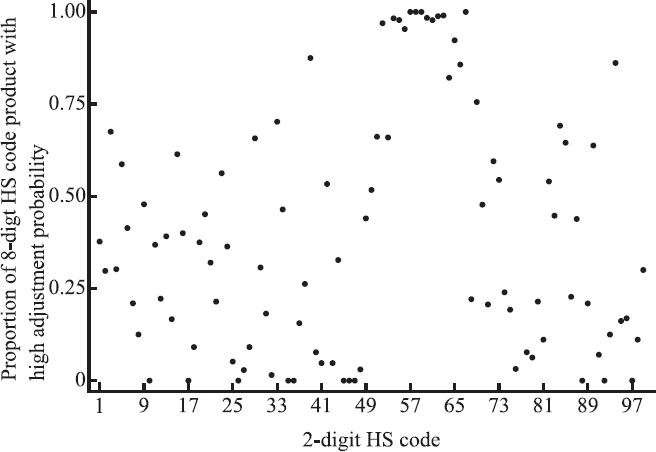
Proportion of Products with High Adjustment Probability

Yearly Distribution of Rebate Rate and VAT Rate Adjustments
The main contributions of this paper are as follows: First, it provides a new perspective for understanding the full picture of China’s export VAT rebate policy. Existing research and news reports focus on the level of VAT rebate rate and the central-local government VAT rebate sharing mechanism, while this paper focuses on the probability of VAT rebate rate adjustments and the policy uncertainty, which helps to fully understand the development and impact of China’s export VAT rebate policy. Second, it provides a preliminary method and indicator basis for studying the uncertainty of export VAT rebate policy. Indicator measurement is the starting point of empirical analysis. This paper takes the lead in using the export tax rebate rate database data released by the State Taxation Administration to measure the uncertainty of export VAT rebate policy, which is measured as unexpected fluctuations of export tax rebate rates at the product level. Third, it expands the connotation of trade policy uncertainty. Most existing literature considers tariff changes in trading partners as the only source of trade policy uncertainty. This paper selects export VAT rebate policy as a new entry point, and reveals the impact and mechanism of policy uncertainty on export growth through theoretical and empirical analysis, which complements the existing literature.
The rest of this paper is arranged as follows: Section 2 reviews the existing literature. Section 3 explains the data and processing process. Section 4 introduces the indicator measurement method and presents its stylized facts. Section 5 studies the impact of export VAT rebate policy uncertainty on export growth from both theoretical and empirical perspectives. Section 6 concludes and provides policy recommendations.
2 Literature Review
2.1 The Measure of Uncertainty
Identifying and measuring economic uncertainty is the starting point and key difficulty of relevant empirical research. Measurement methods can be roughly divided into five categories. The first category uses stock market prices or other macroeconomic variables to measure fluctuations over time (Lu and Liu, 2017). The second category uses the dispersion of cross-sectional economic data, such as productivity shocks (Bloom et al., 2018). The third category uses the prediction error of relevant economic variables (Jurado et al., 2015). The fourth category uses economic policy uncertainty indexes based on text analysis to indicate economic uncertainty (Baker et al., 2016). The fifth category uses relatively exogenous policy events to measure economic uncertainty, such as China’s entry into the WTO (Feng et al., 2017; Handley and Limão, 2017). Export VAT rebate is an important trade policy in China. In detailed research areas, the representation of policy uncertainty varies. Given that tariff is the most important factor affecting trade and the most common policy tool, and data availability is high, a large number of studies interpret trade policy uncertainty as uncertainty in tariffs, that is, the possibility of current tariffs rising to the tariff ceiling (Qian and Gong, 2017). For instance, Pierce and Schott (2016), Feng et al. (2017), and Qian and Gong (2017) directly used the difference between applied tariffs and tariff ceilings to measure trade policy uncertainty.
Based on the aforementioned literature, the uncertainty of export VAT rebates can be measured by the following indicators: First, the fluctuation of the ratio of actual VAT rebates to total exports, but the availability of actual VAT rebate data is poor. Second, the export VAT rebate policy uncertainty index can be constructed based on the method of Baker et al. (2016), but it is a time series variable. Third, exogenous events that cause changes in export VAT rebate uncertainty, but such exogenous events are rare. This paper measures the uncertainty of export VAT rebates by unexpected fluctuations in export VAT rebate rate for the first time, and its calculation approach is similar to the existing literature, focusing on the deviation of the variable’s true value from its expected value. Compared with the aforementioned measurement methods, this paper’s indicators have the following advantages: First, this method is more compatible with theoretical models. Second, it changes in both product and time dimensions, which is conducive to empirical testing and identification. Third, the required data is highly available and the method is highly operable.
2.2 The Impact of Uncertainty on Exports
Export enterprises need to make upfront investments in consumer surveys, customer searches, and other aspects. Based on the irreversibility of investment, option theory suggests that the higher the uncertainty, the greater the value of postponing investment and obtaining new information to avoid investment decision-making errors (Bernanke, 1983). Therefore, uncertainty will inhibit exports, especially their extensive margin. Studies by Roberts and Tybout (1997), and Eaton et al. (2008) provide explanations for this. From a bilateral perspective, the decline in import demand in trading countries is another mechanism by which uncertainty affects exports. Due to the high fixed costs of importing, companies will reduce inventory and significantly reduce (capital goods) imports when uncertainty increases (Novy and Taylor, 2020).
A large number of literature have empirically analyzed the impact of uncertainty on exports (Grier and Smallwood, 2007; Lu and Liu, 2017). Specifically, regarding trade policy uncertainty, existing literature has also found negative impacts on export trade based on different analytical frameworks (Handley, 2014; Handley and Limão, 2015; Pierce and Schott, 2016; Feng et al., 2017; Handley and Limão, 2017; Qian and Gong, 2017). Pierce and Schott (2016) and Handley and Limão (2017) found that the decline in trade policy uncertainty significantly promoted the growth of China’s exports to the United States, based on the background of China’s accession to WTO. Feng et al. (2017) found that this impact was mainly reflected in the extensive margin. Existing literature considers tariff changes in importing countries as the main source of trade policy uncertainty, while this paper selects the export VAT rebate policy as a new perspective to supplement and expand existing literature, while providing new evidence for the positive significance of macro policy stability emphasized by the Chinese government.
3 Data Description
This paper uses the export VAT rebate rate database (version 2021B) released by the State Taxation Administration and the China Customs Import and Export Database (hereinafter referred to as the Customs Database). The sample time is restricted to 2004 to 2015, which represents the common window period of the two sets of data.
3.1 Export VAT Rebate Rate Library
The export VAT rebate rate database records the VAT rates, export rebate rates, implementation and termination dates, product names, and measurement units for products in different-digit HS codes since 2004. The unprocessed export VAT rebate rate database contains samples of products in 8-digit, 9-digit, 10-digit, and 11-digit HS codes. Estimating the uncertainty index of export VAT rebates requires information on the VAT rate and rebate rate for each product-year. This paper assigns corresponding indicators of each product-year by taking the weighted average (according to the adjustment time) of the adjust rate of rebate rate of the product whose VAT rate or tax rebate rate is adjusted during the year. At the same time, in order to match the customs database for empirical analysis, this paper needs to calculate the rebate rate, VAT rate, and uncertainty of export VAT rebates for products at the level of 8-digit HS code. We refer to the approach of Qian et al. (2015) and calculate the simple average of the VAT rate and rebate rate for high-digit HS code products to the 8-digit HS code level. Then we obtain the panel data at the 8-digit HS code product-year level. It should be noted that in the end, the HS codes in the export VAT rebate rate database are the codes used in the current year (i.e., the original codes). Before calculating the average value of the indicators, this paper first converts the HS codes of the observations to the HS2002 version, obtaining a total of more than 93,000 observations for 8901 8-digit HS code products, each of which lasts 10.5 years on average.
3.2 Customs Database
When cleaning the customs database, this paper mainly removes observations with missing company names. Subsequently, we aggregate the raw data from the customs database to the product-trade mode-year level. In addition, due to the large time span of the sample, there are also issues with changes in the HS code version in the raw data from the customs database. This paper also converts them to the HS2002 version uniformly.
3.3 Other Problems in the Process of Data Processing and Corresponding Solutions
The correspondence between HS code and the China Industrial Classification (CIC)
This paper requires to aggregate the HS code at the product level to the industry level, refering to the correspondence table provided by the World Integrated Trade Solution (WITS) database and the National Bureau of Statistics’ publication of the China Industrial Classification of National Economic Activities, to manually complete the conversion of “8-digit HS code products-4-digit ISIC code industries-4-digit CIC code industries”
Matching two sets of data
The processed export VAT rebate rate data is at the product-year level, while the customs database is at the product-trade mode-year level. This paper first uses the export VAT rebate rate data to calculate the export VAT rebate uncertainty index at the product-year level, and then matches this index to the customs database based on product and year information.
4 Measurement of the Uncertainty of the Export VAT Rebate Policy
4.1 Measurement Method
This paper uses the unexpected fluctuations in the export VAT rebate rate of products to measure the uncertainty of export VAT rebates. The meaning is that enterprises form expectations for previous export VAT rebate policy based on known information and compare them with observable actual policies. The deviation between the two is the part that enterprises cannot predict. If this unpredictable part fluctuates greatly over time, enterprises believe that it cannot form accurate expectations for future policies, and the uncertainty is also large. In specific measurement, the uncertainty of export VAT rebate is the standard deviation of the portion of the export VAT rebate rate (or the proportion of the export VAT rebate rate to the value-added tax rate) in the previous three years that cannot be explained by relevant factors (estimated residuals).
This paper uses the 4-digit CIC code industry-year and 2-digit HS code product fixed effects to control the influencing factors of export VAT rebate rate as comprehensively as possible. The specific calculation process is as follows. First, for each year T, estimate the equation:
Among them, the subscripts hs8, hs6, and hs2 represent the products at the corresponding levels, and cic4 represents the 4-digit CIC code industries. When estimating for each T, we define t ∈ {T − 3, T − 2, T − 1}, that means three years before the year T[1]. The dependent variable, ratehs8,t is the weighted adjustment of the product-year level rebate rate. To consider the differences in VAT rates for products, this paper uses two methods to measure ratehs8,t, which are the export VAT rebate rate and the proportion of export VAT rebate rate to VAT rate (referred to as the VAT rebate ratio). As mentioned earlier, it is assumed that enterprises can observe all information that has occurred (before period T), and form expectations for the VAT rebate rate based on known information and compare it with the actual VAT rebate rate. Including fixed effects in the explanatory variables is equivalent to considering all known information at the corresponding level. In addition, we draw on the approach of Wang and Xie (2010) to include the MFN tariff (tariffhs6,t) on product imports to consider the degree of protection of products.
Residual ε is the key variable required for indicator measurement, representing the portion of the export VAT rebate rate (or VAT rebate proportion) that cannot be explained by φcic4×t φhs2 and tariffhs6,t. This represents the deviation of the actual export VAT rebate rate from the enterprise’s expectations, which is the “unexpected portion” mentioned earlier. Next, calculate the fluctuation degree of this “unexpected portion” over time, which is the standard deviation of each product’s ε over time, to measure the uncertainty of export VAT rebate for this product in year T. The uncertainty index calculated using the VAT rebate rate and VAT rebate proportion as the dependent variables is denoted as un_tsl and un_tsbl respectively. Since the earliest data on export VAT rebate rate is from 2004, the uncertainty index is available from 2007 to 2015.
4.2 Measurement Results and Characteristic Facts
For the ease of comparison, this paper standardizes the two uncertainty indexes un_tsl and un_tsbl according to (x-xmin)/(xmax-xmin), setting their values between 0 and 1. Unless otherwise specified, the standardized uncertainty indexes are used throughout the rest of this paper.
Overall distribution
The density distributions of the two indexes are illustrated in Figure 4. The standard deviations and percentile values of un_tsl and un_tsbl are similar, which can be attributed to the narrow range of product VAT rate adjustment from 2004 to 2015 (see Figure 3)[1], and the trend of rebate rate and rebate ratio are similar. In terms of specific values, the median of the two indexes (approximately 0.006) is lower than the mean (approximately 0.038), and significantly lower than the 99th percentile (approximately 0.379) and the maximum value (1), indicating a highly right-skewed overall distribution

Uncertainty Index Density Distribution
Considering that the magnitude of uncertainty may be related to the number of rebate rate adjustments, an uncertainty index is used to regress on the number of VAT rebate rate adjustments over the past three years, and the distribution and fitting are plotted in Figure 5. It can be seen that the more VAT rebate rate adjustments there are for a product, the higher the uncertainty[1].

Uncertainty Index and the Number of VAT Rebate Rate Adjustments
Distribution in different years
As shown in Figure 6, it is confirmed again that the distribution of the two uncertainty indexes, un_tsl and un_tsbl, are highly similar. The uncertainty of export VAT rebate increase first and then decrease during the sample period. Combining the conclusions of Figure 3 and Figure 5 about the positive relationship between uncertainty and the number of adjustments to the VAT rebate rate, the upward trend from 2007 to 2010 may be related to two events: First, the government adjusted the export structure in 2007, significantly reducing the VAT rebate rate for “high pollution, high energy consumption, resource-based” products and products that are prone to trade friction. Second, the financial crisis in 2008 forced Chinese government to expand exports to stimulate economic growth.

Year Distribution of the Uncertainty Index
Distribution of different categories
This paper divides products into 22 categories based on the “Import and Export Commodity Names and Codes”. Taking the mean value of the full sample of 0.038 as the dividing line, we can find that low uncertainty products are mainly concentrated in China’s traditional advantageous industries, such as wood, paper, textile, clothing and footwear products in categories 9, 10, 11 and 12, machines, machinery, equipment and parts in categories 16, 17 and 18, and miscellaneous in category 20 products including furniture and toys. The above industries experienced rapid export growth during the sample period in this paper, which may be related to the low level of export VAT rebate policy uncertainty to some extent.
5 The Impact of the Uncertainty in the Export VAT Rebate Policy
5.1 Theoretical Explanation
According to China’s export VAT rebate policy, enterprises usually prepay VAT during the intermediate product transaction process, and then receive a certain amount of tax refund based on different trade types when exporting. Since the tax collection and refund processes occur in the purchase of intermediate products and the sale of finished products respectively, this paper adopts a two-stage game. In the first stage, the upstream suppliers sell intermediate products to the downstream exporters, who pay taxes. In the second stage, the exporters sell final products to foreign consumers, while some taxes are rebated.
Let the demand function of the destination country for the representative export enterprises be p (q)=α-q where q is sales volume of the product. The marginal production cost of the export enterprise is cE, the per-unit price of the intermediate product is ω, and the marginal cost of the intermediate product supplier is cM. The government’s tax rate on the intermediate product transaction is τ1. If downstream enterprises’ export volume is q, and the VAT rebate rate is τ2, then the actual tax paid by the export enterprise is (τ1-τ2) ωq.
According to Equation (1), the uncertainty of export VAT rebate is characterized by the deviation of the actual VAT rebate rate from the expected level. Let ρ represent the expectation of the VAT rebate rate for the enterprise, which follows a normal distribution with mean μ and standard deviation σ. The standard deviation σ is the unexplained error term, which represents the degree of uncertainty. The profit of the export enterprise is:
To measure the impact of uncertainty τ on decision makers, according to Pratt (1964), a monotonic transformation is applied to Equation (2). Assume that the utility function is U(π) = −e−λπ, where λ = −U″(·)/U′(·) reflects the degree of aversion to uncertainty, and the expected utility is EU(π).
By further simplifying and applying a monotonic transformation to the objective function (3), the problem of maximizing the expected profit of the enterprise can be expressed as:
In the first stage, the intermediate product supplier and the exporter execute the intermediate product transaction. The profit maximization problem of the intermediate product supplier is:
In the second stage, the exporter sells the final product. Given the price of intermediate goods ω, the export enterprise chooses q to maximize expected profits (4). The first-order condition with respect to q qives the demand function q(ω) of the exporter for intermediate goods. After substituting it into Equation (5), the equilibrium output can be obtained:
The impact of uncertainty in taking the derivative of τ from Equation (6) on equilibrium export volume:
Substituting Equation (6) into p(q*) q* and taking the derivative of σ yields the impact of uncertainty on export trade volume:
Meanwhile, due to p′(q*) < 0, it is known that the equilibrium price will increase with the increase of uncertainty, that is:
Based on the above results, propositions 1 and 2 of this paper can be derived.
Proposition 1
An increase in the uncertainty of export VAT rebate policy leads to a decrease in equilibrium export quantity.
Proposition 2
An increase in the uncertainty of export VAT rebate policy leads to a decrease in average sales volume and an increase in average price.
Substitute the equilibrium outcome back into Equation (4), and then differentiate Equation (4) with respect to τ to obtain:
Equation (10) shows that the uncertainty of export VAT rebate leads to a decrease in equilibrium profits, causing some enterprises to exit from the destination market and reducing the number of export relationships.
Proposition 3
An increase in the uncertainty of export VAT rebate policy leads to a decrease in expected equilibrium profits, which ultimately leads to a decrease in the number of export relationships.
In summary, the increased uncertainty of export VAT rebate has reduced the expected profits of export enterprises, which in turn has made their decisions more pessimistic, resulting in a reduction in production and export quantity and hence the equilibrium price rises.
5.2 Estimation Strategy
The basic econometric model for empirical analysis in this article is set as follows:
Among them, hs8 and t represent the 8-digit HS code product and the year, respectively. The explained variable g(exp)hs8,t is the ordinary (or processing) export growth rate of 8-digit HS code product in year t, which is measured by (total export volume of the product in the current year/total export volume of the product in the previous year) - 1[1]. Here, ordinary exports and processing exports are divided into two samples and then summed up for estimation. This is because they enjoy different export VAT rebate policy. In short, ordinary export enterprises apply the “exemption, offset, and refund” management approach. Processing exports can be divided into processing with supplied materials and processing with imported materials. Among them, processing with supplied materials applies the “no tax and no refund” approach; processing with imported materials applies the “exemption, offset, and refund” approach, but intermediate goods imported in the form of processing trade are exempt from import value-added tax and offset when exporting finished products. Therefore, ordinary export is greatly affected by export VAT rebate policy, while processing export with supplied materials is not affected. Processing export with imported materials falls between the two. However, due to data limitations, this paper cannot distinguish between processing with supplied materials and processing with imported materials in detail, so processing export represents the sum of the two.
uncertaintyhs8,t is the uncertainty index un_tsl or un_tsbl calculated in this paper; D is the key coefficient to be estimated, which is expected to be significantly negative in the regression of the ordinary export sub-sample, and relatively small or not significant in the regression of the processing export sub-sample. {FE} represents the fixed effect set, which controls the fixed effects of 8-digit HS code products and 3-digit CIC code industry-year fixed effects in the final model. vhs8,t is the random error term. Considering potential serial correlation issues, if not specifically stated, the standard error is clustered at the 8-digit HS code product level.
5.3 Basic Regression
Table 1 reports the basic regression results. Columns (1) and column (4) control for the fixed effects of 8-digit HS code product year; considering the significant heterogeneity in industry macro trends, we add the fixed effects of 4-digit CIC code industry and year interaction in column (2) and column (5). It should be noted that this paper adds the fixed effects of 4-digit CIC code industry-year when calculating the uncertainty index (as shown in Equation (1)). If products within the same industry have the same VAT rebate rate and import tariff in the past three years, the uncertainty index will be the same. This phenomenon is not uncommon among adjacent products (i.e., products with similar HS codes). Therefore, incorporating the fixed effects of 4-digit CIC code industry-year may significantly reduce within-group variation. In column (3) and column (6), we appropriately relax the industry division criteria, using the fixed effects of 3-digit CIC code industry-year as a substitute, and continue to use this identification strategy in subsequent analysis. The results in each column show that un_tsl and un_tsbl are significantly negatively correlated with the growth rate of ordinary trade exports, but remain non-significant in the processing export sub-sample. These results validate proposition 1 of this paper.
Basic Regression Results
| Ordinary trade | Processing trade | |||||
|---|---|---|---|---|---|---|
| (1) | (2) | (3) | (4) | (5) | (6) | |
| Panel A | ||||||
| un_tsl | –0.509# | –0.533 | –0.794* | 0.201 | 0.411 | 0.517 |
| (0.344) | (0.442) | (0.412) | (0.704) | (1.037) | (0.913) | |
| Fixed effect | hs8, t | hs8, cic4 × t | hs8, cic3×t | hs8, t | hs8, cic4×t | hs8, cic3×t |
| Sample capacity | 56708 | 56621 | 56689 | 49139 | 48937 | 49069 |
| Adjusted R2 | 0.095 | 0.117 | 0.117 | 0.082 | 0.107 | 0.108 |
| Panel B | ||||||
| un_tsbl | –0.774** | –0.754* | –0.997** | 0.568 | 0.815 | 0.795 |
| (0.344) | (0.444) | (0.404) | (0.736) | (1.071) | (0.956) | |
| Fixed effect | hs8, t | hs8, cic4×t | hs8, cic3×t | hs8, t | hs8, cic4×t | hs8, cic3×t |
| Sample capacity | 56259 | 56167 | 56240 | 48829 | 48630 | 48759 |
| Adjusted R2 | 0.095 | 0.117 | 0.117 | 0.081 | 0.107 | 0.108 |
Note: Regression is clustered at the 8-digit HS code product level, with the values in parentheses being standard errors. #, *, **, *** indicate that the coefficients are significant at the 20%, 10%, 5%, and 1% levels, respectively. Unless otherwise noted, the same applies to subsequent tables.
The uncertainty of export VAT rebates theoretically affects the processing exports with imported materials as well. However, the test conducted in this paper, which focuses on the overall processing export, did not produce statistically significant results. One intuitive reason is that the processing export with supplied materials that applies the “no tax, no rebate” method may have caused interference. In addition, the premise of VAT rebates for processing trade enterprises is the purchase of domestic intermediate goods and the prepayment of value-added tax. Therefore, the current results may also be caused by the low localization rate of intermediate goods.
Enterprises need to calculate the amount of tax exemption, offset, and refund based on the product VAT rate and refund rate. Therefore, compared to the absolute level of the rebate rate, the impact of the proportion of the rebate rate on the VAT rate on enterprise decision-making should be more significant, which is consistent with the results of Panel A and Panel B. Due to space limitations, only the results based on un_ tsbl regression are shown in subsequent tables.
5.4 Robustness Test
Endogenous issues
On the one hand, this paper may overlook some time-varying product characteristics, such as national support for specific products. On the other hand, the export VAT rebate policy is an important tool for macroeconomic regulation, and the export growth rate and its underlying policy objectives (such as industrial restructuring) may be important reasons for the government to adjust the export VAT rebate rate. However, the impact of these issues on the conclusions of this paper is limited. Firstly, compared to pure export growth, the export VAT rebate policy is more anchored on its underlying economic growth, exchange rate, employment, and industrial structure goals. Export growth is only a reflection of changes in the domestic and international macroeconomic environment, so the reverse causality problem essentially also omits time-varying characteristics at the product level. The export volume of individual 8-digit HS code products is relatively small, and the adjustment of export VAT rebate rate for individual products is difficult to achieve large-scale macroeconomic goals. If policy adjustments are made for specific industries, the current industry-year fixed effects have already controlled such considerations. Assuming that there are indeed reverse causality problems at the product level, these products should have larger export volumes, and their exclusion may lead to smaller or non-significant estimated coefficients in the ordinary trade sample. However, the regression results of excluding large-scale products (products with annual export values above the 99th, 95th, 90th, or 75th percentiles in the designated trade mode) in this paper did not show corresponding changes, indicating that their impact is limited.
Secondly, there is a certain substitution effect between ordinary and processing export in achieving specific policy goals. If the negative correlation in the estimation of ordinary export samples is caused by reverse causality, then the estimation of processing export samples should also show the same trend. In other words, when the growth rate of processing export declines, the government may adjust the tax rebate rate and achieve the policy goals that should have been achieved by processing export through ordinary export. This logic is particularly applicable against the background of the declining importance of processing export relative to ordinary export in China. Therefore, the lack of correlation between the uncertainty of export VAT rebates and the growth rate of processing export also proves to some extent that the reverse causality problem is not prominent.
Based on the above discussion, this paper further confirms the causal relationship between variables by using the instrumental variable method. The number of VAT rebate rate adjustments in the first three years of the product is selected as the instrumental variable for the uncertainty of export VAT rebate rate. As previously stated, the more VAT rebate rate adjustments, the higher the uncertainty of export VAT rebates, which satisfies the correlation condition of the instrumental variable. Because the number of tax rebate rate adjustments does not contain information about the direction of adjustment, it has no direct relationship with the export growth rate of products, which satisfies the exogenous condition of the instrumental variable[1]. The second-stage test results based on this instrumental variable are shown in column (1) of Table 2. The impact of uncertainty of export VAT rebates on the growth rate of ordinary trade exports is significantly negative, while it has no significant impact on the growth rate of processing exports.
Robustness Test I
| Instrumental variable method | Addressing the issue of zero trade flow | ||||
|---|---|---|---|---|---|
| (1) | (2) | (3) | (4) | (5) | |
| Number of adjustments to the product VAT rebate rate | Samples that have existed for more than 4 years | Samples that have existed for more than 7 years | Balance panel from 2006 to 2015 | Merged into the 6-digit HS code level | |
| Panel A: Ordinary export | |||||
| un_tsbl | –8.315# | –0.820** | –0.911** | –0.594# | –0.519# |
| (5.497) | (0.396) | (0.400) | (0.403) | (0.355) | |
| P value of LM test | 0.000 | ||||
| Wald test F value | 56.232 | ||||
| Panel B: Processing export | |||||
| un_tsbl | –3.547 | 0.833 | 1.315# | 0.903 | 0.555 |
| (9.723) | (0.952) | (0.962) | (1.105) | (0.687) | |
| P value of LM test | 0.000 | ||||
| Wald test F value | 45.742 | ||||
Note: Due to space limitation, the following tables no longer report fixed effects (default is hs8, cic3×t), sample size, and adjusted R2. Ccolumn (5) controls for hs6 and cic3*t fixed effects, clustering at the 6-digit HS code product level.
Addressing the issue of zero trade flow
If the export value of a product in the previous year is zero, the dependent variable cannot be calculated. This paper examines the issue of zero export from the following aspects: First, retain product samples that have existed continuously for a certain number of years. Column (2) to column (4) of Table 2 show the regression results based on samples that have existed continuously for 4, 7, or 10 years (or more)[2]. Second, aggregate the samples to the 6-digit HS code level. Using data at the 6-digit HS code level may lead to the “aggregation fallacy” problem, but it can effectively reduce zero trade samples, which is also used as a reference in this paper. The test results in each column are robust.
Adjust the measurement method of uncertainty index
The key to the validity of the conclusion in this paper lies in the reliability of the uncertainty index. To this end, this paper adjusts the details in the calculation Equation (1) and recalculate this index. First, we adjust the window period of the regression sample and calculate the uncertainty index using data from the past two and four years respectively. Second, we control the total number of adjustments to the tax rebate rate in each year. Third, given that the current VAT rebate rate may be affected by previous tax rebate rates, we control the lagged value of the dependent variable by one period. Fourth, we control other factors that may be related to uncertainty, including the total number of subdivided products within the 8-digit HS code and the standard deviation of VAT rates and tax rebate rates for each product. The regression results as shown in Table 3 are similar to those obtained from the basic regression.
Robustness Test II
| Adjust the measurement method of uncertainty index | |||||
|---|---|---|---|---|---|
| (1) | (2) | (3) | (4) | (5) | |
| Use data from the past 2 years | Use data from the past 4 years | Control the number of VAT rebate rate adjustment | Control the lag of dependent variable by one period | Control other influencing factors | |
| Panel A: Ordinary export | |||||
| un_tsbl | –1.751*** | –0.661# | –0.938** | –0.695# | –1.100*** |
| (0.503) | (0.435) | (0.403) | (0.520) | (0.412) | |
| Panel B: Processing export | |||||
| un_tsbl | 0.123 | 1.588* | 0.368 | 1.538# | 0.642 |
| (1.043) | (0.920) | (0.928) | (1.060) | (0.961) | |
Addressing extreme values
To avoid the impact of extreme values on the results of this paper, we truncated the un_tsbl at the 95th and 90th percentiles, and the regression results are shown in column (1) and column (2) in Table 4. Column (3) further removes samples with uncertainty of 0 based on column (2). The results obtained in each column are robust.[1]
Robustness Test III
| Address extreme values of uncertainty index | Address potential issues in the data cleaning process | |||||
|---|---|---|---|---|---|---|
| (1) | (2) | (3) | (4) | (5) | (6) | |
| Truncate at the 95th percentile | Truncate at the 90th percentile | Truncate at the 90th percentile and remove the 0 value | Excluding samples containing multiple high HS codes | Exclude samples with changes in HS code | Exclude the expoxt share of trade intermediaries | |
| Panel A: Ordinary export | ||||||
| un_tsbl | –1.436# | –2.484* | –3.394* | –1.514*** | –1.208*** | –1.589** |
| (0.933) | (1.463) | (1.828) | (0.490) | (0.413) | (0.634) | |
| Panel B: Processing export | ||||||
| un_tsbl | –2.083# | 0.157 | –1.176 | 1.334 | 0.824 | 0.411 |
| (1.578) | (2.602) | (2.932) | (1.118) | (0.963) | (1.081) | |
Addressing potential problems in the data cleaning process
First, remove samples containing multiple high-level HS codes, that is, retain samples with unique VAT rebate rate information corresponding to the original data. Second, remove samples that have changed HS code between different versions. The regression results remain robust.
Excluding the export share of trade intermediaries
Trade intermediaries can reduce the export costs of enterprises, help low-productivity enterprises enter the international market, and charge higher product prices. We exclude the export share of trade intermediaries. The specific results are shown in column (6) of Table 4. The key explanatory variable coefficients are still significantly negative in the ordinary trade sub-sample results.
5.5 The Decomposition of the Trade Volume
A preliminary exploration: sales volume or price
This paper uses the Equation (11) to regress product sales volume g(quantity)hs8,t and price growth rate g(price)hs8,t on the uncertainty of export VAT rebates. The results are shown in Table 5 Panel A. For ordinary export, the sales growth rate decreases as the uncertainty of export VAT rebates increases; the price growth rate slightly increases as the uncertainty of export VAT rebates increases, thus verifying proposition 2 of this paper. The results in Panel B indicate that the uncertainty of export VAT rebates has no significant impact on the product sales volume and price growth rate of processing export.
Breakdown of Export Volume: Sales Volume and Price
| g(quantity) | g(price) | |||||
|---|---|---|---|---|---|---|
| (1) | (2) | (3) | (4) | (5) | (6) | |
| Panel A: Ordinary export | ||||||
| un_tsbl | –0.654# | –0.965* | –1.017** | 0.119* | 0.166* | 0.156* |
| (0.415) | (0.522) | (0.485) | (0.070) | (0.093) | (0.085) | |
| Panel B: Processing export | ||||||
| un_tsbl | 0.631 | 0.493 | 0.182 | 0.098 | –0.058 | 0.033 |
| (0.899) | (1.341) | (1.121) | (0.088) | (0.126) | (0.110) | |
Note: The fixed effects in column (1) and column (4) are hs8 and t; columns (2) and (5) are hs8 and cic4×t; column (3) and column (6) are hs8 and cic3×t.
The number of export relationships
This paper further decomposes the total sales volume of products into the number of product-country level export relationship multiplied by the corresponding average sales volume. We also distinguish the entry and exit status of export relationships within a specific product, in order to explore the structural changes in product sales, export relationship quantity, and average price. The two independent variables for the entry and exit status of export relationships are defined as follows: For a specific 8-digit HS code product, if there is a firm-country export relationship that exists in year t, and if it did not exist in year t-1, then entry is defined as 1 (entry); if it existed in year t-1, then entry is defined as 0 (in place); if it does not exist in year t+1, then exit is defined as 1 (exit); if it exists in year t+1, then exit is defined as 0 (continuing)[1].
We calculate the total number of export relationships, the number of entries, and the number of exits within each product-year-trade mode, and calculate their corresponding growth rates, denoted as g(no), g(no_entry), and g(no_exit). The results in column (1) of Panel A in Table 6 indicate that the increase in uncertainty in export VAT rebates significantly reduces the growth rate of the number of export relationships in ordinary trade, which confirms proposition 3 in this paper. From the results in column (2) and column (3) of Table 6, it can be seen that the growth rates of both the number of entries and exits in export relationships are significantly negatively correlated with uncertainty in export VAT rebates. However, according to the definition method used in this paper, the decrease in the growth rate of exits may be closely related to the slowdown in the growth rate of entries. Many studies have also found that the duration of Chinese companies’ exports is relatively short (Li et al., 2014), and the decrease in the number of entries in export relationships will directly lead to a contraction in the number of exits and a decrease in the growth rate of exits. If we control the growth rate of the number of entries in export relationships in the current year based on the regression in column (3), the absolute value of the uncertainty index coefficient will significantly shrink, and the significance level will also be significantly reduced (see column (4)), which confirms the speculation in this paper. The results in Table 6 indicate that the slowdown in the number of entries in export relationships is the main reason for dragging down the growth rate of total numbers.
Quantitative Growth Rate of Export Relationship
| g(no) | g(no_entry) | g(no_exit) | g(no_exit) | ||
|---|---|---|---|---|---|
| (1) | (2) | (3) | (4) | ||
| Panel A: Ordinary trade | |||||
| un_tsbl | –0.089* (0.051) |
–0.136** (0.062) |
–0.134** (0.053) |
–0.014 (0.027) |
|
| g (no_entry) | 0.795*** (0.011) |
||||
| Panel B: Processing trade | |||||
| un_tsbl | –0.073 (0.099) |
–0.209* (0.121) |
–0.102 (0.117) |
0.061 (0.052) |
|
| g (no_entry) | 0.741*** (0.006) |
||||
6 Conclusions and Policy Implications
This paper measures the uncertainty of export VAT rebate policy for the first time, shows its characteristic facts, and examines its impact on China’s export growth. The characteristic facts show that the overall distribution of policy uncertainty measured by unexpected fluctuations in export VAT rebate rate is highly right-skewed, and the more times the product VAT rebate rate is adjusted, the higher the uncertainty. From a time-series perspective, uncertainty showed an upward trend from 2007 to 2010 and then continued to decline. From a product category perspective, traditional advantageous industries represented by machinery and textiles faced lower uncertainty. This paper obtains consistent analysis results on the impact of China’s export growth from both theoretical and empirical perspectives: the increase of uncertainty of export VAT rebate policy significantly reduces the growth rate of ordinary exports, but has no impact on the growth rate of processing exports. This paper further decomposes the export trade volume and find that the decline in the growth rate of ordinary volume is mainly due to a significant decrease in product sales growth rate, while its average price growth rate increases. The decrease in product sales growth rate is caused by a simultaneous decrease in the number of export relationships and average sales growth rate, mainly due to the slowdown in the entry speed of export relationships and the low sales volume of new export relationships. Similarly, the impact of export tax rebate uncertainty on price growth rate is only reflected in new export relationships.
The Central Committee of the Communist Party of China has explicitly stated in multiple important meetings and speeches that “macro policies should maintain continuity, stability, and sustainability”. This paper provides new evidence to illustrate its positive significance and has important policy implications. The adjustment of export VAT rebate rate plays a rapid and effective guiding role in the production and industrial development of export products, but it is not conducive to the stable growth of export in the medium and long term. Appropriately reducing the frequency of export VAT rebate rate adjustments, ensuring policy continuity, and avoiding policy reversals caused by wide adjustments can help stabilize policy expectations and thus help achieve the goal of stabilizing foreign trade and expanding exports. In addition, the negative impact of uncertainty in export VAT rebate policy mainly focuses on new entrants to the export relationship. Given that “exploratory” exports are an important way for companies to understand the profitability of their products and a key basis for making later export decisions, and that export market and product diversification are inevitable choices for Chinese enterprises under the current complex international political and trade relations, stabilizing the expectation of export VAT rebate policy is an effective measure to cope with trade dilemma and release trade potential.
References
Baker, S. R., Bloom, N., & Davis, S. J. (2016). Measuring Economic Policy Uncertainty. The Quarterly Journal of Economics, 131(4), 1593–1636.10.1093/qje/qjw024Search in Google Scholar
Bernanke, B. S. (1983). Irreversibility, Uncertainty, and Cyclical Investment. The Quarterly Journal of Economics, 98(1), 85–106.10.2307/1885568Search in Google Scholar
Bloom, N., Floetotto, M., Jaimovich, N., Saporta-Eksten, I., & Terry, S. J. (2018). Really Uncertain Business Cycles. Econometrica, 86(3), 1031–1065.10.3982/ECTA10927Search in Google Scholar
Eaton, J., Eslava, M., Kugler, M., & Tybout, J. (2008). Export Dynamics in Colombia: Firm-Level Evidence. In E. Helpman, E. Marin & T. Verdier (Eds.), The Organization of Firms in a Global Economy (pp. 231–272). London: Harvard University Press.10.32468/be.522Search in Google Scholar
Feng, L., Li, Z., & Swenson, D. L. (2017). Trade Policy Uncertainty and Exports: Evidence from China’s WTO Accession. Journal of International Economics, 106, 20–36.10.1016/j.jinteco.2016.12.009Search in Google Scholar
Grier, K. B., & Smallwood, A. D. (2007). Uncertainty and Export Performance: Evidence from 18 Countries. Journal of Money, Credit and Banking, 39(4), 965–979.10.1111/j.1538-4616.2007.00053.xSearch in Google Scholar
Handley, K. (2014). Exporting under Trade Policy Uncertainty: Theory and Evidence. Journal of International Economics, 94(1), 50–66.10.1016/j.jinteco.2014.05.005Search in Google Scholar
Handley, K., & Limao, N. (2015). Trade and Investment Under Policy Uncertainty: Theory and Firm Evidence. American Economic Journal: Economic Policy, 7(4), 189–222.10.1257/pol.20140068Search in Google Scholar
Handley, K., & Limão, N. (2017). Policy Uncertainty, Trade, and Welfare: Theory and Evidence for China and the United States. American Economic Review, 107(9), 2731–2783.10.1257/aer.20141419Search in Google Scholar
Jurado, K., Ludvigson, S. C., & Ng, S. (2015). Measuring Uncertainty. American Economic Review, 105(3), 1177–1216.10.1257/aer.20131193Search in Google Scholar
Li, K., Jiang, W., & Song, L. (2014). The Mystery of Quality Changes in Chinese Export Products: A Micro Explanation Based on Market Entry. Social Sciences in China (Zhongguo Shehui Kexue), (3), 80–103.Search in Google Scholar
Long, G. (2009). Establish a System of Full Export Tax Rebates. International Business Daily.Search in Google Scholar
Lu, X., & Liu, J. (2017). Uncertainty and China’s Export Growth. Economic Research Journal (Jingji Yanjiu), 52(9), 39–54.Search in Google Scholar
Novy, D., & Taylor, A. M. (2020). Trade and Uncertainty. Review of Economics and Statistics, 102(4), 749–765.10.1162/rest_a_00885Search in Google Scholar
Pei, C. (2008). On the Goal of Converting Export Tax Refund Policies. Finance & Trade Economics (Caimao Jingji), (2), 10–16,127.Search in Google Scholar
Pierce, J. R., & Schott, P. K. (2016). The Surprisingly Swift Decline of US Manufacturing Employment. American Economic Review, 106(7), 1632–1662.10.1257/aer.20131578Search in Google Scholar
Pratt, J. W. (1964). Risk Aversion in the Small and in the Large. Econometrica, 32(1/2), 122–136.10.2307/1913738Search in Google Scholar
Qian, X., & Gong, L. (2017). Trade Policy Uncertainty, Regional Trade Agreement and China’s Export of Manufacturing Industry. China Industrial Economics (Zhongguo Gongye Jingji), (10), 81–98.Search in Google Scholar
Qian, X., Pan, Y., & Mao, H. (2015). Export Tax Rebates, Enterprise Cost Markup and Resource Misplacement. The Journal of World Economy (Shijie Jingji), 38(8), 80–106.Search in Google Scholar
Roberts, M. J., & Tybout, J. R. (1997). The Decision to Export In Colombia: An Empirical Model of Entry with Sunk Costs. The American Economic Review, 84(4), 545–564.Search in Google Scholar
Wang, X., & Xie, S. (2010). The Political Economy of China’s Tax Rebate Policy. Economic Research Journal (Jingji Yanjiu), 45(10), 101–114.Search in Google Scholar
© 2024 Yanzhe Zhang, Helian Xu, Xiaokai Shao, published by De Gruyter
This work is licensed under the Creative Commons Attribution 4.0 International License.
Articles in the same Issue
- Frontmater
- Frontmatter
- Column: China's Economic Development
- Energy Price Fluctuation and Real Estate Market Risk Prevention—Empirical Evidence at the Prefecture-Level City Level in China
- Are the Green TBTs a Stimulus or a Trap for Enterprises’ Green Technology Development?
- The Impact of Global Value Chain Embedment on Energy Conservation and Emissions Reduction:Theory and Empirical Evidence
- Balancing Openness and Protection:Homogenization of Regulatory Laws in Digital Service Trade
- Uncertainty of the Export VAT Rebate Policy: Measurement and Its Effects
- Theoretical Mechanisms and Suggestions for Fostering the Economic Resilience of Chinese Cities from the Perspective of Urban Social Networks