Design and analysis of metamaterial superstrate and FSS reflector loaded UWB antenna for the detection and localization of breast tumors
-
Priyanka Grover

 and
Sanjay Kumar Sahu
and
Sanjay Kumar Sahu

Abstract
Objectives
This paper investigates an efficient UWB biosensor that employs monostatic radar-based microwave imaging (RBMI) to identify cancerous cells in human breast tissue.
Methods
The proposed FSS-loaded lens applicator biosensor assembly combines three designs, including a UWB radiator, a frequency selective surface (FSS) reflector, and a square-shaped split ring metamaterial cell (SSR-M). In Computer Simulation Technology-Microwave Studio (CST-MWS) simulator, a lens applicator (UWB transceiver with SSR-M at its front side) when loaded with an FSS reflector is simulated with a breast phantom (BP), then the system performance is assessed in the context of backscattered parameters, penetration depth (PD), and specific absorption rate (SAR). Experimental validations of the fabricated prototype are captured using the Vector Network Analyzer (VNA).
Results/Key findings
Signal processing steps are applied over the S11 signals using MATLAB, to detect the depth/location of the malignant tissue. The proposed system is capable of detecting a minimum tumor size of 4 mm up to a maximum localization depth of 30 mm. The proposed system has an isotropic gain of 3.6 dBi and a SAR of 1.07 W/kg over 1 g of tissue.
Conclusions
As a result, the proposed biosensor configuration is suitable option for microwave imaging applications.
Introduction
According to reports, breast cancer is one of the leading causes of mortality for women worldwide. Statistics indicate that 1 in 8 women will be diagnosed with breast cancer at some point in the course of their lives [1]. In accordance with the World Health Organization (WHO), “Breast cancer can not be prevented. Nevertheless, early-stage identification can help to prevent cancer-related fatalities” [2], [3], [4]. It can be detected using several diagnostic techniques, comprising CT scans, X-ray mammography, ultrasound imaging, and magnetic resonance imaging (MRI). Unfortunately, X-ray radiography produces a significant number of falsely positive diagnoses (greater than 5 %) as well as false negative diagnoses (in the range of 10–30 %). High-resolution images are provided via MRI, but in some cases, supine positioning can lead to soft tissue deformation, which leads to positional errors in MRI [5], 6]. Furthermore, the performance evaluation of such diagnostic methods in terms of specificity, positive predictive value, accuracy, and sensitivity is provided in [7], 8]. In addition, early-stage breast tissue malignancy can not be detected using the previously mentioned tumor identification methods [9], [10], [11]. Consequently, we need a technology that is less expensive than the existing techniques, has fewer false negative and false positive results, and can identify cancerous cells in early phases [12]. This serves as inspiration for creating an FSS-loaded lens applicator-based microwave transceiver system [13].
The key objective of microwave imaging is to distinguish between tumorous and normal breast tissues, utilizing differences in their electrical characteristics in the FCC ultra-wideband (UWB) frequency range of 3.1–10.6 GHz [14], [15], [16]. Current microwave sensor-based tumor detection techniques have several drawbacks. First, there is a trade-off between penetration depth and high frequencies. Second, the UWB sensor is large, and accurate replication of the dielectric characteristics of human cells is not precisely considered while designing artificial breast phantom models. Therefore, researchers have suggested several methods to increase the directional characteristic of microstrip antennas and get larger bandwidth, including changing the substrate thickness and using lower permittivity substrates with truncated ground structures [17], [18], [19], [20], [21], [22], [23], [24].
This work study’s primary goal is to create a stepped tapered [25], [26], [27], [28], [29] feedline super compact FSS-loaded lens applicator structure to be used as a biosensor, to locate the malignancy in biomedical imaging applications. To know more about the superstrates, various kinds of literature have been reviewed, which led to a new era in antenna engineering with the introduction of negative index metamaterials (MTMs) [30], 31]. In literature [32], 33] researchers have proposed using MTMs as superstrates to increase certain antenna properties, such as its efficiency.
Additionally, numerous publications have shown that the use of capacitively loaded loop (CLL) metamaterials as superstrates can suppress the propagation of surface waves, reducing mutual coupling in the vicinity [34], [35], [36]. These attributes of metamaterials increased interest in antennas for use in biomedical imaging. The field of metamaterials has evolved by implementing various methods such as split-ring-like structures [37], 38]. The metamaterial-based antenna has been prioritized in the design of the microwave imaging (MWI) system due to its compactness, cost-effectiveness, and ease of fabrication. Furthermore, to achieve better penetration depth at lower frequencies MTM structures are incorporated with a UWB radiator to locate the accurate depth of the tumor [39].
Frequency selective surfaces can be capacitive, or they can be designed to its complementary inductive FSSs. The square loop FSS is taken into consideration because the square loop resonates at smaller dimensions compared to the circular ring [40]. An integration of FSS with a UWB radiator can be a potential tool to improve the antenna directivity, bandwidth, and suppression of back lobe radiations [41]. An FSS when placed in the proximity of the antenna’s ground plane can act as a reflecting plane to extend the operating frequency range [42]. Additionally, artificial magnetic conductors (AMC) reflectors are used at the rear of the antenna to lessen the back lobe field and boost the depth of penetration, increasing the radiation efficiency of the antennas in terms of front-to-back ratio [43], 44]. This work presents a design approach of an affordable and efficient UWB biosensor system that employs monostatic radar-based microwave imaging (RBMI) to detect undesired malignant cells within the human body. Firstly, a stepped tapered 50 Ω matched feedline UWB antenna is designed. Secondly, a new single-layer FSS structure of a 3 × 3 unit cell is designed and positioned on the UWB antenna’s rear to reduce back lobe radiation. Finally, to focus more radiations towards the phantom, a single square-shaped split ring metamaterial unit cell (SSR-M) working as a superstrate is designed and placed at the front side of the UWB radiator. The proposed stepped tapered feedline microstrip patch antenna (STFMPA) has a defective ground plane to boost the bandwidth. The malignant cell in the target area can diagnosed by a difference signal, that can be computed by subtracting the backscattered S 11 (dB) values [i.e., S 11 d(t) = S 11 (t) with tumor ∼ S 11 (t) without tumor].
Materials and methods
STFMPA design progress steps
The proposed antenna design consists of a tapered feedline and circular flared patches of optimized radius 3.5 mm which are deposited at the top layer of the FR4 substrate, and the bottom layer of the proposed UWB transceiver consists of a defective ground plane having a geometrical structure as shown in Figure 1(A). A copper annealed material with a 35 μm thickness makes up the top and bottom layers of a FR4 substrate. Figure 1(B) illustrates the design progress steps of the proposed STFMPA, whereas Figure 1(C) shows the comparison of reflection coefficients for the various design progression steps.

(A) Proposed UWB antenna’s top layer and bottom layer with parameters L=12.7 mm, M=2 mm, W=9 mm, K1=0.5 mm, R=3.5 mm, N=2 mm, J=3 mm, K=1.8 mm, D=1.5 mm, P=2 mm, E=1 mm, S=0.5 mm, A=3 mm, T=1 mm, B=2 mm, T1=2 mm, C=1 mm, T2=1 mm, F=2 mm, T3=0.5 mm, G=4 mm, T4=1.5 mm, H=2 mm, (B) design evolution of the proposed UWB antenna, (C) S11 comparison for the various design progress steps, (D) S11 variations with the radius of patch ‘R’ (E) S11 variations with the ground length ‘K’, (F) S11 variations with the feedline width ‘A’, and (G) real impedance graph w.r.t. feedline width ‘A’.
Initially, in Step 1, a circular patch with a straight feedline and a partial ground is created, which results in the narrow bandwidth of 2 GHz ranging from 4 to 6 GHz with impedance matching −37 dB at 4.9 GHz. Likewise, changes are made to the ground where two concentric squares and two slotted triangles are created to increase the bandwidth which is termed Step 2. The changes performed in Step 2 provide bandwidth from 4.2 to 7 GHz with impedance matching that is poor at 5.2 GHz, around −16 dB. In the next Step-3, when some triangular flares are added in the patch along with a few other structural modifications, then we observe a frequency range of 4.1–7.9 GHz, with impedance matching of −20 dB at 5.1 GHz. Step 3, however, is unable to produce the requisite ultra-wide bandwidth. Now, the Step 4 which is termed as “Proposed STFMPA”, modifications in the feedline are performed. In this final step stepped tapering is added to the feedline, improving impedance matching and increasing bandwidth range i.e., 4–9.5 GHz with impedance matching of nearly −16 dB at 4.2 GHz and −27 at 7.6 GHz. Furthermore, this stage of the “Proposed STFMPA” also satisfies the need for a reduced resonance frequency, which is a crucial prerequisite for MWI application for improved penetration depth (as stated in equation number 1 i.e., resonance frequency is inversely propotional to penetration depth). However, as Figure 1(C) illustrates, all of these enhancements to the “Proposed STFMPA” step result in a trade-off of higher order harmonics at 7.6 GHz.
Where µ0, is permeability constant, µr is relative permeability (usually 1), σ is conductivity of target material, and fr is resonance frequency of the proposed antenna respectively.
Discussion on higher order harmonics at 7.6 GHz
In final step of “Proposed STFMPA”, feedline tapering is introduced so as to compensate an abrupt step transition between ground and feedline. The proposed antenna’s feedline is composed of various ratios of taper widths and taper height i.e., A:F, B:G, and C:H (as shown in Figure 1(A)), these “width:height” ratio values are dependent mainly upon the characteristics impedance Z0 and dielectric constant (ε r ) as given in equation number (2.1) and (2.2) [45]. Therefore any dimensional change in feedline tapering can directly affect Z0, and hence the same is observed for the final step of “Proposed STFMPA” (as in Figure 1(C)) in which a higher order harmonics is observed at 7.6 GHz. Although, as mentioned above that P.D. is better at lower resonance frequency (4.2 GHz) therefore dip at 7.6 GHz can be neglected for tumor detection application. However, in order for an antenna to have an efficient radiation characteristics, higher order harmonics must be properly handled, which means that the dip at 7.6 GHz must also be lessened. This will be covered in subsection “Systematic integration of the proposed STFMPA, FSS reflector, and SSR-M unit cell as a biosensor assembly”.
Where X:Y can take any value out of A:F, B:G, and C:H as per taper height to width ratio as given in Figure 1(A).
Parametric optimization of the proposed STFMPA
Figure 1(D) shows that when the patch radius is R=3 mm, poor impedance mismatching is observed, whereas on R=4 mm, a narrow bandwidth is obtained; therefore R=3.5 mm is the optimum value taken into consideration. Further, the ground plane length ‘K’ is taken into consideration for optimization.
As shown in Figure 1(E), it is observed that on each value of K, a graph is exhibiting an approximate equality in bandwidth, but there is a variation in impedance matching, so while investigating the simulated results for characteristics impedance on all the three values of K, it was found that on K=1.8 mm an exact impedance match of 50 Ω was found, therefore K=1.8 mm is the optimum value. It is interesting to note in Figure 1(F) that when feedline width ‘A’ is other than 3 mm, a trade-off between impedance match and bandwidth is observed, but when the feedline width value is considered to be 3 mm, a good compromise between bandwidth and impedance is observed (Figure 1(G)).
Numerical modeling of the patch radius ‘R’ (as shown in Figure 1(A)) can be performed using the various equations as mentioned in [25], 28], [46], [47], [48].
Design strategy of the proposed FSS unit cell
The design evolution of the FSS reflector unit cell begins with a square patch [as in Figure 2(A)]. The top layer of the substrate over which a square copper structure is constructed has a thickness of 35 μm; the reflector structure is simulated by employing periodic boundary conditions and a floquet port at the top face, as shown in Figure 2(B). The linear magnitude of the square patch unit cell covers a less range of frequency band with a magnitude value of one as shown in Figure 2(C), whereas in a square ring patch structure in which a cell geometry is modified by subtracting a smaller square slot [as in Figure 2(A)] leads to a better coverage of frequency band with reflection magnitude value of one as shown in Figure 2(C). Moreover, while investigating the reflection phase of the square patch unit cell the artificial magnetic conductor (AMC) with phase 0° [40] is observed at nearby 6 GHz whereas, for the square ring patch i.e., the proposed unit cell, the “0” degrees phase is observed between 4 and 5 GHz as shown in Figure 2(D), which is also in approximate range with the resonating frequency of the proposed STFMPA.

(A) Design evolution of the FSS unit cell with square patch and square ring patch with parameters L1=5 mm, Y=4 mm, h=1.6 mm, Z=2 mm and (B) simulation setup of the FSS unit cell in CST, (C) variation of S11 linear magnitude with frequency, (D) variation of S11 reflection phase with frequency, (E) design evolution of the SSR-M unit cell with parameters U=14 mm, T=10 mm, S=6 mm, Q=2 mm, W1=1 mm, (F) simulated S11–S21 parameters of the various steps of proposed SSR-M unit cell alone without the presence of reflector and antenna, and (G) parametric optimization on SSR-M length U with fixed gap width W1=1 mm, (H) parametric optimization on SSR-M gap width W1 with fixed length U=14 mm, and (I) comparison of isotropic gain 3D radiation pattern of lens applicator with variation in length and gap width of SSR-M unit cell.
Parametric optimization of the proposed SSR – MTM unit cell
The design evolution of the SSR unit cell begins with a ‘Step-1’ as shown in Figure 2(E), very poor resonance is observed for Step-1’s S11 parameter and the S21 transmission coefficient is also not in good agreement with the correlation factor [as in Figure 2(F)]. Therefore, in design progress Step-2 one additional strip line with a gap is inserted which leads to the improvement in the S21 parameter, but very fewer changes are observed in S11 in comparison to Step-1. Furthermore, in the proposed SSR-M cell one additional strip line with a gap is inserted which leads to better agreement of S11 and S21 parameters within the 4–5 GHz. It is observed in this final step of “Proposed SSR-M” that the proposed unit cell has a half-power (3 dB) bandwidth of 1 GHz in the range 4–5 GHz which indicates a left-handed band, and in this frequency range reflection coefficient peak is polarization independent and transparent to the transmission peak [49] and hence better agreement of S11 and S21 parameters exists within the 4–5 GHz range. Furthermore, several modifications are performed to the unit cell length “U” and gap “W1” parameters in order to analyse the parametric optimisation of the proposed SSR-M unit cell. Hence in this subsection parametric optimization is applied on the proposed SSR-MTM unit cell structure in integration with proposed STFMPA. Figure 2(G) shows the parametric optimization for SSR-M length “U” with fixed gap width W1=1 mm in this graph at U=13 mm, the observed UWB band exist from 3.9 to 9.4 GHz but a poor impedance matching is observed, between 5 and 7 GHz range (as the S11 magnitude line is about to touch −10 dB threshold), whereas on U=15 mm, a higher order harmonic is observed at 7.2 GHz which is not viable for MWI application because higher order harmonics gives lesser depth of penetration in body phantoms as given in equation number 1; therefore U=14 mm is the optimum value taken into consideration because at this value of “U” a better compromise is observed amongst UWB bandwidth, impedance match and an additional lower order harmonic in the 4–5 GHz range. Figure 2(H) shows the parametric optimization for gap width “W1” with fixed length U=14 mm, in this graph it is observed that on each value of gap width W1, a graph is exhibiting an approximate equality in bandwidth, but there is a variation in impedance matching, so while comparing the higher order harmonic value it was found that on W1=1 mm the higher order harmonic value is minimum i.e.,−31 dB (whereas for other values of W1 it is −34 and −40 dB), and lower order harmonic value is maximum i.e., −27 dB (whereas for other values of W1 it is approximately in the range of −17–19 dB), therefore W1=1 mm is the optimum gap width value for better penetration depth of EM waves for MWI applications. Additionally, the gain is observed for each parametric value of U and W1 during the parametric optimisation process. It is evident from Figure 2(I) that the isotropic gain 3D radiation pattern of the lens applicator changes incrementally with variations in the length and gap width of the SSR-M unit cell. Furthermore the most optimal value of gain with the most optimised value of U=14 mm and W1=1 mm will be examined in subsection “Systematic integration of the proposed STFMPA, FSS reflector, and SSR-M unit cell as a biosensor assembly” in Figure 3(D).

(A) Systematic integration of the proposed STFMPA, FSS reflector, and SSR-M unit cell as a biosensor assembly, (B) comparison of reflection coefficients (C) comparison of voltage standing wave ratio, and (D) comparison of 3D radiation pattern isotropic gain.
Results and discussions
Systematic integration of the proposed STFMPA, FSS reflector, and SSR-M unit cell as a biosensor assembly
This subsection is organized into various steps, to begin with, the simulation analysis, firstly an open space STFMPA antenna (as shown in Figure 3(A)) is simulated in free space, this proposed STFMPA exhibits an operational bandwidth of ∼5 GHz with an Ultra wideband range from 4.2 to 9.6 GHz. Secondly, when the same UWB antenna is loaded with an FSS reflector at a distance of d1=5 mm at its back then the right shift in the frequency band is observed with an Ultra wideband range from 4 to 11 GHz resulting in a bandwidth of 7 GHz. Then, in the third simulation step bandwidth parameter is analyzed within an assembly of a lens applicator in which the SSR-M cell is placed at a distance of d2=10 mm on the front side of the UWB antenna, this leads to the left shift in the frequency band with an Ultra wideband range from 3.3 to 9.2 GHz resulting in a bandwidth of 5.9 GHz. Finally, when the lens applicator assembly is loaded with an FSS reflector, than it leads to an Ultra wideband range from 3.4 to 11 GHz as shown in Figure 3(B). The simulated VSWR values are plotted over the frequency range from 2 to 12 GHz as shown in Figure 3(C), and it is evident from the VSWR graph that, among all other configurations with a VSWR value less than 2, the FSS loaded lens applicator structure covers the highest range of frequency (3.4–11.2 GHz). The simulated 3D radiation pattern isotropic gain is shown in Figure 3(D), which clearly indicates the improvement in gain parameters from 1.13 to 3.6 dBi, within a systematic integration of the proposed STFMPA, FSS reflector, and SSR-M unit cell. Moreover, the UWB transceiver works as a biosensor for microwave imaging (MWI) applications, it is very important that better impedance matching should occur at lower frequencies because lower frequency has better penetration depth and while investigating the resonant frequency for various steps of the reflector and superstrate integration it has been observed that there is a trade-off between bandwidth and impedance match in first three steps, whereas there is an acceptable compromise between bandwidth and lower resonance frequency in FSS loaded lens applicator structure (as shown in Figure 3(B)). Furthermore it has been observed that with the integration of superstrate and reflector higher order harmonics at 7.6 GHz are also suppressed from −30 dB (as shown in Figure 1(C)) to −20 dB (as shown in Figure 3(B)).
Analysis of FSS loaded lens applicator with breast phantom
A microwave signal directed at a certain region on an individual’s body would reflect differently in healthy and malignant tissue because these two types of cells have varying moisture contents. To emit such microwave signals, we have designed an imaging setup made up of an FSS-loaded lens applicator that is not only appropriate for biomedical microwave imaging (MWI) but also aids in achieving a greater depth of penetration. Using CST Microwave Studio [50], a hemispherical three-layer breast phantom is made in a 3-D simulator that precisely replicates the dielectric characteristics of a female breast. The electrical properties of each layer of a female breast can be given as follows: Skin layer has a permittivity=36.59, conductivity=2.35 S/m, and density=1,010 kg/m3; Fat layer has a permittivity=4.84, conductivity=0.236 S/m, and density=928 kg/m3; Tumor area has a permittivity=67, conductivity=49 S/m, and density=1,058 kg/m3 [51], 52]. As a result, it is possible to carry out the MWI of the target of interest, by sending UWB radiations through an FSS-loaded lens applicator system as shown in Figure 4(A).

(A) Perspective view of hemispherical breast phantom positioned in front of proposed FSS loaded lens applicator, and (B) simulation setup in CST-MWS with the human body voxel, and (C) S11 simulation analysis without and with tumors of variable sizes.
The magnified view of the imaging area is shown in Figure 4(B), and this simulation setup is also used to analyze the SAR over the human body in the breast area. The observed SAR value is 1.07 W/kg, and it is also within the permitted FCC safer limit range (i.e., less than 1.6 W/kg per gram of tissue) [51]. The time derivative of the additional energy (dW) consumed in an additional mass (dm) contained in a volume element (dV) of a specific density (ρ) is known as the Specific Absorption Rate (SAR) as given in equation number from 3rd to 6th [53], 54].
The SAR quantity related to the internal electric-field is given by:
where, σ is the electrical conductivity of the tissue (S/m), ρ is the mass density in kg/m3, E is the root mean square (RMS) of the electric field strength in volts per meter, and J is the current density (A/m2) in the tissue. Table 1 gives the tabulated analysis of Figure 4(C) in terms of simulated backscattered signals variation with tumored and without tumor phantoms at diverse frequencies ranges. In this table the last two columns that are “Diagnosis of tumor” and “Difference in magnitude” are directly correlated with each other, i.e., with the increase in the magnitude difference (|with tumor-without tumor|) the chances of tumor diagnoses also increases.
Simulated backscattered signals variation with breast phantoms at diverse frequencies ranges.
| Frequency band (GHz) | Frequency disparity observed at (GHz) | S11 with tumor (dB) | S11 without tumor (dB) | Difference in magnitude (dB) |with tumor − without tumor| |
Diagnosis of tumor | ||||
|---|---|---|---|---|---|---|---|---|---|
| For 3 mm tumor | For 4 mm tumor | For 3 mm tumor | For 4 mm tumor | For 3 mm tumor | For 4 mm tumor | For 3 mm tumor | For 4 mm tumor | ||
| 4.5 to 5.2 | 4.651 | 4.862 | −20.96 | −23.57 | −19.72 | 1.24 | 3.85 | Very weakly noticeable | Noticeable |
| 5.6 to 6.8 | 5.87 | 5.87 | −16.782 | −14.79 | −17.29 | 0.508 | 2.5 | Not noticeable | Weakly noticeable |
| 7.2–8.6 | 8.42 | 8.45 | −22.32 | −20.02 | −22.63 | 0.31 | 2.61 | Not noticeable | Weakly noticeable |
Ground penetrating radar (GPR) algorithm
The steps involved in the GPR depth estimation are described below:
Step 1: Signal pre-processing analysis: Two reflection coefficients i.e., S11 (without tumor) and S11 (with tumor) are preprocessed in the frequency domain, which is followed by their time domain conversion using Inverse Fast Fourier Transform (IFFT). The various pre-processing stages are shown in Figure 5(A).
Referring to Figure 5(B), simulated findings are received in the 2–12 GHz frequency range. To produce a full S11 response from 0 to 12 GHz, a frequency range from 0 to 2 GHz must be padded with zeroes [as per Figure 5(C)]. Furthermore, the Hermitian complex conjugate property is applied to this complete S11 (0–12 GHz) response to achieve a complete complex conjugate spectrum of S11 as shown in Figure 5(D).
Step 2: Calculation of difference signal: In this research, a tumor is deemed to be present within the window range of Zmin=1 mm to Zmax=40 mm because, according to the clinical data provided in [55], 56], the presence of a tumour region for a certain age group of females can be considered within the above considered window range (as shown in Figure 5(E)).
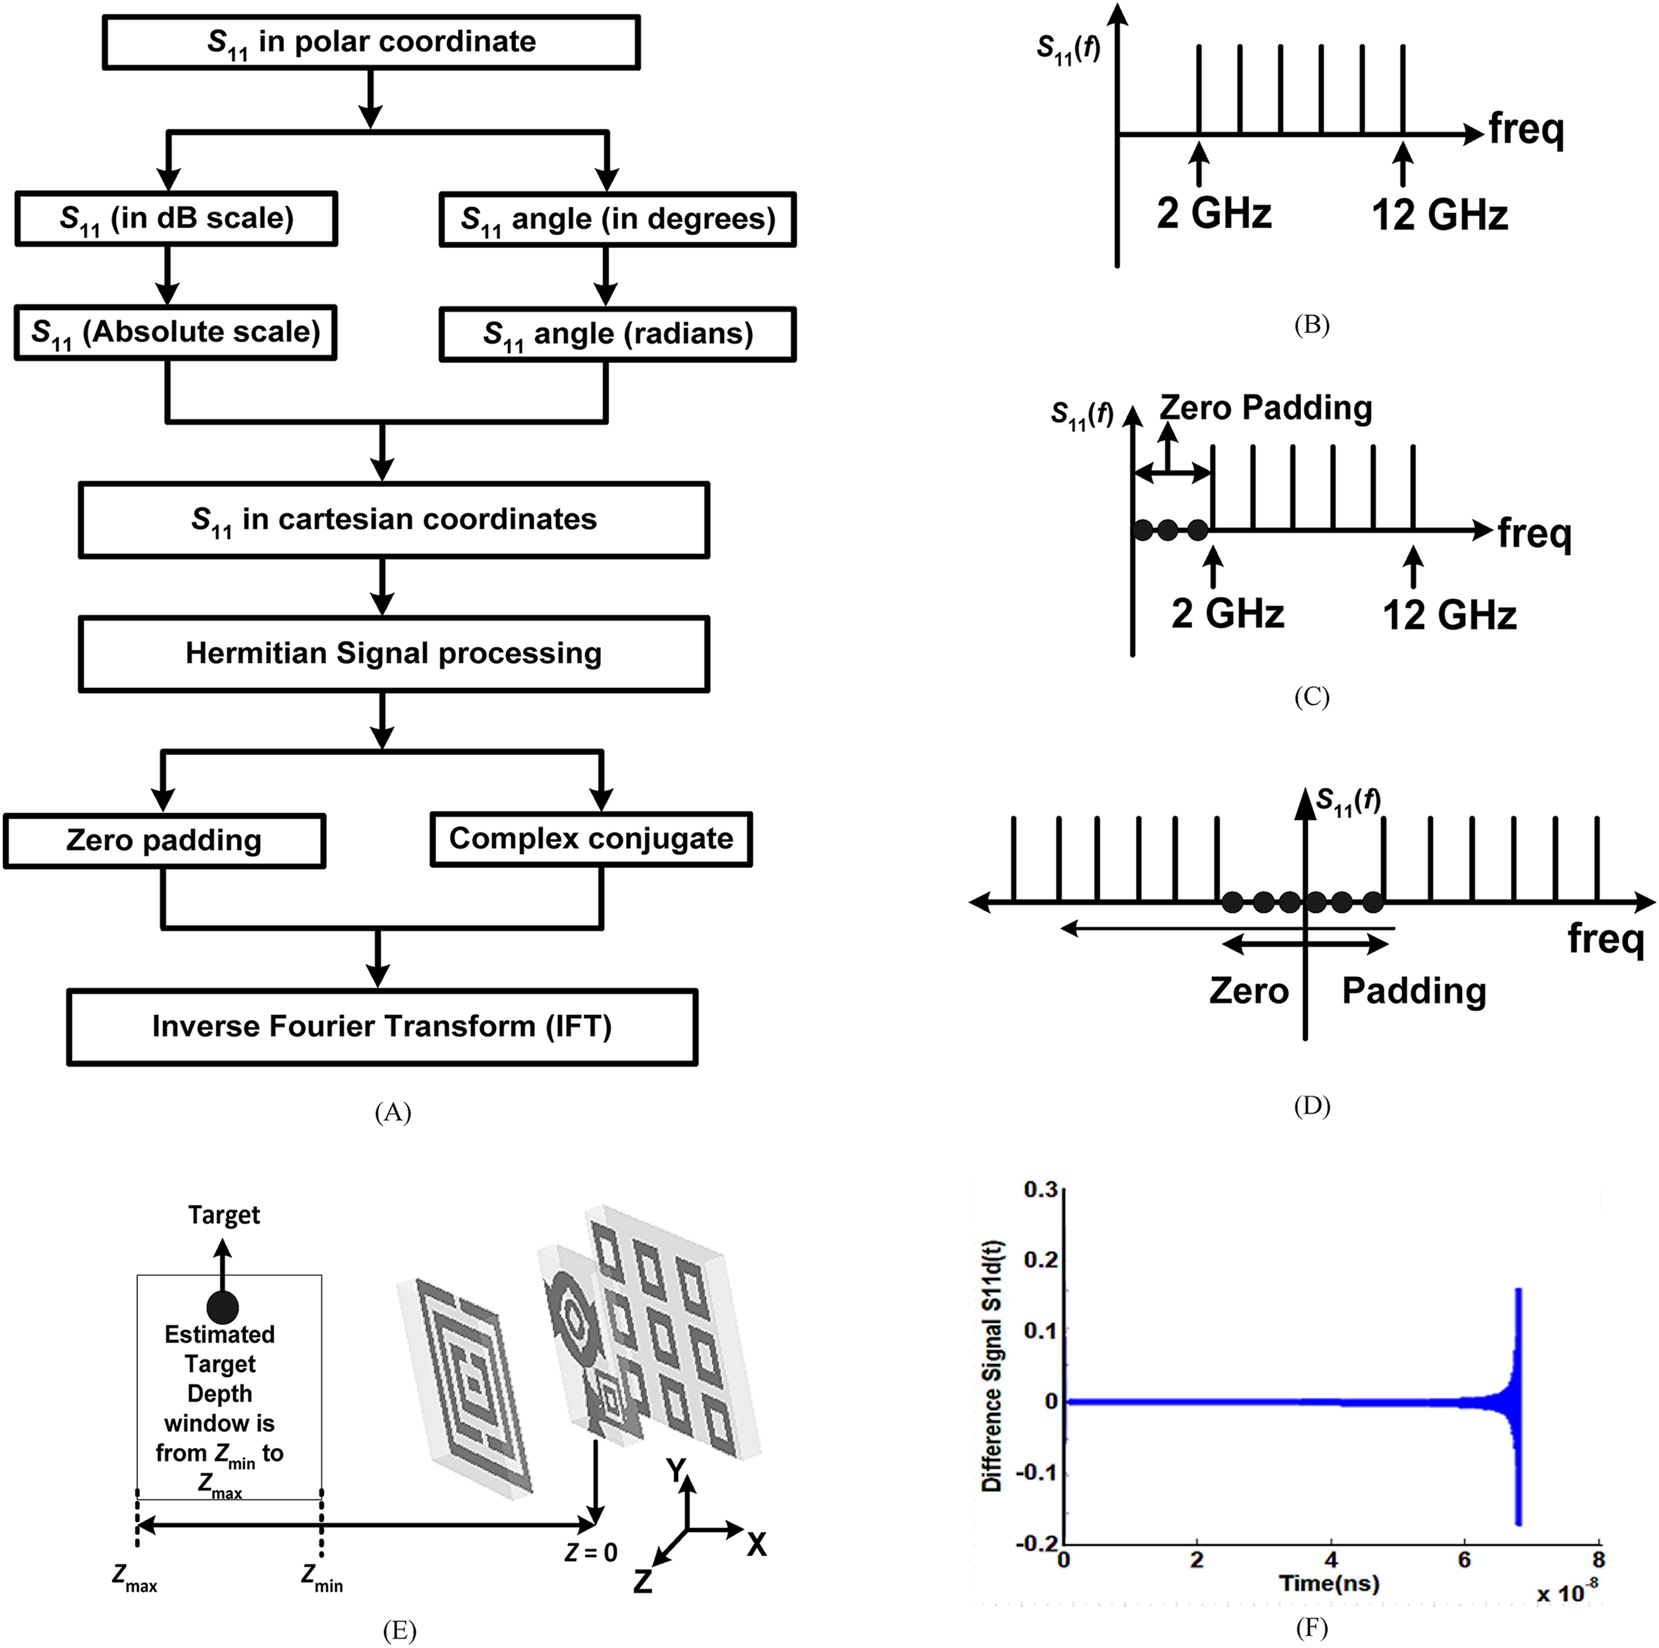
(A) Preprocessing stages, (B) Cartesian S11 (f), (C) zero-padding, (D) complex-conjugate transformation, (E) FSS loaded lens applicator position at Z=0 with respect to the target location, and (F) difference S11 d(t) signal.
The backscattered signals sampling frequency fs can be given as Equation (7) [11];
where, fstop is 12 GHz (i.e., the last frequency of the considered frequency range in the S11 graph as shown in Figure 4(C). Time resolution Δt can be numerically defined as the inverse of sampling frequency, as per Equation (8);
As a result, the following Equation (9) is used to determine the depth of resolution;
where, v is the free space velocity of light, and the depth vector Z is calculated as per Equation (10):
Out of the total of 2,404 impulse response samples, each sample results in a time resolution of 0.027 ns therefore the total of 2,404 samples will result in a total resolution time of 65 ns as depicted in the x-axis of Figure 5(F). Then, this resulting difference signal, S11 d(t) is reconstructed into a scaled image, depicting the tumor depth locations inside the breast using MATLAB software.
Prototypes fabrication and estimation of various tumor depths
An FR-4 substrate with a thickness of 1.6 mm is utilized to start the fabrication of the stepped tapered feed antenna. Two different layers of Rogers RT-duroid 5,880 substrate have a loss tangent (tan δ) of 0.009, and a dielectric constant (ε r ) of (2.2) is utilized during the photolithography process of FSS reflector and SSR-M unit cell fabrication. Additionally, a sub-miniaturized version-A connector is soldered between the feedline and ground plane termination to activate the antenna.
Preparation techniques of an artificial breast phantom are available in various kinds of literature such as in [24] a heterogeneous tissue breast model is created using a mixture of gelatin–in–oil, while in [22] a rectangular container of precise dimensions is used, this container is made up of polyethylene, which is depicted as the skin layer, and the fatty tissues are imitated by filling the polythene with petroleum jelly. In [57] a mixture of black carbon, graphite, and urethane rubber has been used and glycerin/canola oil is used to mimic the dielectric properties of fatty tissues.
References [58], [59], [60] examine the dielectric property replication of biological phantoms throughout a frequency range of 3–6 GHz and come to the conclusion that both sodium chloride and polyethylene powder affect conductivity of an artificial phantom whereas polyethylene powder primarily affects relative permittivity. As a result of which, this proposed article utilizes a heterogeneous biological tissue equivalent phantom model with a mixture of 3,375 gm deionized water, 104.6 gm agar powder, 21.5 gm sodium chloride, and 54.8 gm polyethylene powder/propylene glycol used in proper proportions specifically for a frequency range of 3–6 GHz. Moreover, to create tumor in the phantom, a mixture of 2.5 gm water and 5 gm wheat flour (5 gm) (permittivity ε r =23, conductivity σ=2.57) has been utilized [51]. The production flow chart for artificial gel type tissue-emulating (ATE) phantoms is shown in Figure 6(A) [61].
![Figure 6:
(A) Production process for artificial gel type tissue-emulating (ATE) phantoms [61], (B) experimental setup of fabricated FSS loaded lens applicator with VNA in the presence of artificial phantom, (C) comparison of measured and simulated S11 parameters with and without tumor, (D) tumor (sizes 3 and 4 mm) depth calculation with FSS loaded lens applicator, (E) simulation scenario of multistatic radar-based microwave imaging, (F) simulation analysis of various depths of tumor (size 4 mm) with FSS loaded lens applicator, and (G) comparision of maximum estimated depth of tumor of size 4 mm with systematic integration of the proposed STFMPA, FSS reflector, and SSR-M unit cell.](/document/doi/10.1515/bmt-2024-0427/asset/graphic/j_bmt-2024-0427_fig_006.jpg)
(A) Production process for artificial gel type tissue-emulating (ATE) phantoms [61], (B) experimental setup of fabricated FSS loaded lens applicator with VNA in the presence of artificial phantom, (C) comparison of measured and simulated S11 parameters with and without tumor, (D) tumor (sizes 3 and 4 mm) depth calculation with FSS loaded lens applicator, (E) simulation scenario of multistatic radar-based microwave imaging, (F) simulation analysis of various depths of tumor (size 4 mm) with FSS loaded lens applicator, and (G) comparision of maximum estimated depth of tumor of size 4 mm with systematic integration of the proposed STFMPA, FSS reflector, and SSR-M unit cell.
The fabricated prototype of the FSS-loaded lens applicator with VNA (Keysight, ENA-5063A) is placed in the proximity (10 mm) of an artificially prepared phantom as shown in Figure 6(B). During VNA measurement small fabrication tolerances or an alignment error in the reflector’s, UWB antenna, or superstrate’s layer, can lead to a mismatch in impedance metrics, and the same could also account for modest variations between measured and simulated results as shown in Figure 6(C).
Furthermore, in order to analyze the size vs. depth variation of the proposed FSS loaded lens applicator structure, two simulated scenarios are examined. In these scenarios, tumors of both sizes – 4 and 3 mm, are truly embedded in two distinct breast phantoms at a depth of 15 mm from the breast skin layer interface. While examining the depth of the tumor (3 mm in size), it is found that the estimated depth value is 11 mm, whereas the expected depth value is 15 mm. This results in a 36 % error and a 64 % localization accuracy.
In another simulation scenario (i.e., tumor size 4 mm), it is found that the estimated depth value is 14.95 mm (as shown in Figure 6(D)), compared to the expected depth value of 15 mm, resulting in a 5 % error and a 95 % localization accuracy. Since 36 % inaccuracy for smaller tumours is significant, incorporating “Multistatic radar-based microwave imaging (M-RBMI)” [51] into future research will be the most efficient way to reduce the error percentage in localisation. In M-RBMI arrangements, as seen in Figure 6(E), three FSS loaded lens applicator structures are positioned around the hemispherical breast phantom. One design is positioned in parallel, while the other two are positioned at positive and negative 90° angles to the breast phantom, respectively. Since all three FSS-loaded lens applicators will transmit and receive signals simultaneously in a multistatic radar-based microwave imaging technique therefore three data sets of backscattered signals will be received from all potential coordinate axes i.e., X–Y plane, Y–Z plane, and Z–X plane. Therefore by applying iterative signal processing steps to these three data sets of backscattered signals, a more accurate target location can be found, lowering the localisation error.
Figure 6(F) illustrates that the proposed FSS loaded lens applicator biosensor assembly can localize tumors at different depths, such as 3 mm, 6 mm, 11 mm, and so forth. Performance improvement in PD within a systematic integration of the proposed STFMPA, FSS reflector, and SSR-M unit cell is depicted in Figure 6(G). Hence, this analysis confirms that the proposed system is capable of detecting minimum tumor size of 4 mm up to a maximum depth of 30 mm from the breast skin layer interface in monostatic radar based imaging setup.
Comparison of the proposed tumor detection method with existing techniques
Although tumor detection methods have been covered in a number of publications, SAR analysis is rarely addressed in a wide range of literature [16], 23], 24]. Nevertheless, since SAR analysis is an essential component of biomedical imaging, it is crucial for human safety when exposed to electromagnetic radiation.
Some of the other research on MWI depicts antennae with a poor impedance match [62]. Complicated structural elements are proposed in [63], 64], and many other research articles do not validate their findings using artificial phantoms [23]. But in the proposed article, various performance analysis metrics such as SAR analysis and basic terms and concepts of the relevant topic which are necessary to detect and localize tumor are discussed with the validation of results.
Numerous other diagnostic methods, such as computed tomography (CT) scans, ultrasound imaging, magnetic resonance imaging (MRI), and X-ray, can be used to identify cancer. Unfortunately, these diagnostic methods use high level of radiation of power spectral density in range of 20–30 dBm that brings a number of health hazards, including an unexpected possibility of benign tissue change to malignant tissue, and are also partially successful in treating females with denser tissues present within the breast [5] whereas UWB waves have a power spectral density of −41.3 dBm, which is significantly lower than that of other diagnostic techniques. Therefore, due to this non ionizing nature of UWB radiations, there are negligible chances of benign tissue change to malignant tissue. Furthermore, microwave imaging setup is compact and portable, which can be easily installed inside the ambulances and hence making it accessible to the first responder paramedical teams. In general the average approximate cost (INR) of various diagnostic methods are: X-rays mammography cost between Rs. 200 and Rs. 2000, CT scans cost between Rs. 2500 and Rs. 5000, MRIs cost between Rs. 1500 and Rs. 25000, ultrasounds cost between Rs. 600 and Rs. 3000 [65], MWI costs between Rs. 1000 and Rs. 2500 for breast tumor analysis, and Rs. 2000 to Rs. 3000 for head/brain tumor analysis.
Hence, imaging using microwave technology has the potential to offer a cheap, secure system with a fair level of precision of localization accuracy of 95 %. The comparison given in Table 2 is based on some other parameters such as design type, antenna size, validation with artificial phantom, findings, SAR analysis, tumor detection/localization, and technique used.
Comparison table.
| References | Design type | Size (mm3) | Validation with artificial phantom | Findings | SAR analysis | Tumor detection/localization | Techniques |
|---|---|---|---|---|---|---|---|
| [13] | Double spiral antenna with FSS | Antenna: 32 × 32 × 3.27 FSS: 64 × 64 × 1.57 |
Yes | Temperature distribution analysis, | Yes | No imaging is reported | Monostatic |
| [16] | Coplanar waveguide radiator with AMC | Antenna: 44 × 76 × 1.6 AMC: 76 × 78 × 1.6 |
Yes | Very big size of antenna and AMC. | No | Detection:yes Localization:no |
Multistatic |
| [18] | Textile-based hexagonal shape patch antenna | 54 × 46 × 3 | Yes | Large antenna size | Yes | Detection:yes Localization:no |
Monostatic |
| [21] | Pentagon patch antenna with truncated ground | 30 × 44 × 1.5 | Phantom’s material not reported | Lack of mathematical modeling, | No | No imaging is reported | Monostatic |
| [23] | Tapered slot vivaldi antenna | 26 × 38.5 × 10 | No | S11 and S12 subtraction method | No | Yes | Monostatic |
| [35] | CLL-MTM-loaded patch antennas | Antenna: 80 × 60 × 0.76 MTM: 60 × 14 × 0.76 |
NA | Very big size of the antenna and MTM cell. | NA | NA | Design of patch antenna with metamaterials |
| [39] | Planar left-handed metamaterials | SRR: 0.3 × 4.6 × 0.6. Lattice: 5 × 5 × 2. |
NA | Quantitative and qualitative study of SRR | NA | NA | NA |
| [40] | UWB FSS-based antennas | 50 × 50 × 3 | NA | Diversity operation | NA | No imaging is reported | CPW-fed monopole |
| [41] | Antenna with FSS for GPR application | Antenna: 30 × 30 × 1.6 FSS: 62.5 × 62.5 × 25 |
NA | Big size of FSS and no discussion on the GPR algorithm | No | No imaging is reported | Monostatic |
| [66] | Lens applicator with superstrate | Antenna 32 × 32 × 3.27 superstrate 40 × 40 × 1.6 | Yes | Complicated radiator design and the fabricated phantom are used for hyperthermia treatment. | Yes | No imaging is reported | Monostatic |
| Proposed work | FSS-loaded lens applicator | Antenna: 9 × 12.7 × 1.6 reflector: 20 × 14.5 × 1.6 SSR-M: 14 × 13 × 1.6 |
Yes | Using the GPR algorithm backscattered signal analysis is carried out for tumor localization | Yes | Yes | Monostatic |
Conclusions
The proposed FSS-loaded lens applicator design is the most miniaturized design ever reported in research journals relevant to cancer detection and localisation applications. The proposed biosensor assembly is suitable for functions in the UWB band as a result of its unique qualities, which include an easy structure, economical production, biological compatibility, and physiological friendliness. Initially, the designed STFMPA exhibits an operational bandwidth of 5 GHz, with an Ultra wideband range from 4.2 to 9.6 GHz but when this STFMPA is used within the FSS loaded lens applicator assembly then, this leads to an Ultra wideband range from 3.4 to 11 GHz. Therefore, the proposed setup provides a 50 Ω impedance matched bandwidth of 7.6 GHz with the simulated SAR result i.e., 1.07 W/kg, which is also within the FCC’s permissible limit of 1.6 W/kg per 1 g of tissue. The approach proposed in the paper uses the GPR algorithm to estimate the tumor depth. The proposed FSS loaded lens applicator can measure the maximum estimated tumor depth up to 30 mm for minimum tumor size of 4 mm. Hence, imaging using microwave technology has the potential to offer a cheap, secure system with a fair level of precision of localization accuracy of 95 %. The proposed system has an isotropic gain of 3.6 dBi. Furthermore, it is observed that when only open space antenna is used to radiate microwaves towards the breast phantom then the maximum observed PD is 14 mm, but when the same STFMPA is used within the assembly of FSS loaded lens applicator then there is an improvement of 16 mm in the estimated depth due to which maximum achieved PD is 30 mm. Additionally, with the help of VNA, the experimental validation of the proposed setup is carried out with the fabricated prototype along with an artificial breast phantom, and it is observed that the measured results are in good agreement with the CST-MWS simulated outcomes. However, the primary goal of the above mentioned research is to locate malignancy within the breast. This effort is not enough to give therapy for patient recovery, even though it is the first step towards treatment. In order to overcome the limitations of this study, this research will be expanded in the future to obtain an effective therapeutic approach. Therefore, in order to improve penetration depth and minimise localisation error in real-time imaging and begin patient treatment as soon as possible, we can expand our study domain from monostatic radar-based microwave imaging to mutistatic radar-based real-time imaging. To eradicate any cancer in its early stages, similar clinical trials can be carried out using the temperature radiation approach, also known as hyperthermia therapy.
Acknowledgments
The authors are thankful to Science and Engineering Research Board (SERB), Government of India for providing financial support to carry out this work under a project (File No. CRG/2022/001256). Also, we are thankful to Antenna Research Laboratory, TIET, Patiala, for providing the necessary instrument facility to carry out the measurement.
-
Research ethics: Not applicable.
-
Informed consent: Not applicable.
-
Author contributions: All authors have accepted responsibility for the entire content of this manuscript and approved its submission.
-
Use of Large Language Models, AI and Machine Learning Tools: None declared.
-
Conflict of interest: The authors state no conflict of interest.
-
Research funding: Science and Engineering Research Board (SERB), Government of India, File No. CRG/2022/001256.
-
Data availability: Not applicable.
References
1. Iliopoulos, I, Di Meo, S, Pasian, M, Zhadobov, M, Pouliguen, P, Potier, P, et al.. Enhancement of penetration of millimeter waves by field focusing applied to breast cancer detection. IEEE Trans Biomed Eng 2020;68:959–66. https://doi.org/10.1109/tbme.2020.3014277.Search in Google Scholar PubMed
2. www.who.int/health-topics/cancer.Search in Google Scholar
3. www.medicalnewstoday.com/articles/37136#causes.Search in Google Scholar
4. Payne, A, Merrill, R, Minalga, E, Hadley, JR, Odéen, H, Hofstetter, LW, et al.. A breast-specific MR guided focused ultrasound platform and treatment protocol: first-in-human technical evaluation. IEEE Trans Biomed Eng 2020;68:893–904. https://doi.org/10.1109/tbme.2020.3016206.Search in Google Scholar
5. Kuhl, CK, Schrading, S, Leutner, CC, Morakkabati-Spitz, N, Wardelmann, E, Fimmers, R, et al.. Mammography, breast ultrasound, and magnetic resonance imaging for surveillance of women at high familial risk for breast cancer. J Clin Oncol 2005;23:8469–76. https://doi.org/10.1200/jco.2004.00.4960.Search in Google Scholar PubMed
6. Richey, WL, Heiselman, JS, Ringel, MJ, Meszoely, IM, Miga, MI. Computational imaging to compensate for soft-tissue deformations in image-guided breast conserving surgery. IEEE Trans Biomed Eng 2022;69:3760–71. https://doi.org/10.1109/tbme.2022.3177044.Search in Google Scholar PubMed PubMed Central
7. Berg, WA, Gutierrez, L, NessAiver, MS, Carter, WB, Bhargavan, M, Lewis, RS, et al.. Diagnostic accuracy of mammography, clinical examination, US, and MR imaging in preoperative assessment of breast cancer. Radiology 2004;233:830–49. https://doi.org/10.1148/radiol.2333031484.Search in Google Scholar PubMed
8. Hassan, AM, El-Shenawee, M. Review of electromagnetic techniques for breast cancer detection. IEEE Rev Biomed Eng 2011;4:103–18. https://doi.org/10.1109/rbme.2011.2169780.Search in Google Scholar PubMed
9. Karli, R, Ammor, H. Miniaturized UWB microstrip antenna with T-slot for detecting malignant tumors by microwave imaging. Int J Micowave Opt Technol 2014;9:214–20.Search in Google Scholar
10. Bohra, S, Shaikh, T. UWB microstrip patch antenna for breast cancer detection. Int J Adv Res Electron Commun Eng 2016;5:1–3.Search in Google Scholar
11. Selvaraj, V, Sheela, JB, Krishnan, R, Kandasamy, L, Devarajulu, S. Detection of depth of the tumor in microwave imaging using ground penetrating radar algorithm. Prog Electromagn Res M 2020;96:191–202. https://doi.org/10.2528/pierm20062201.Search in Google Scholar
12. Bahrami, H, Porter, E, Santorelli, A, Gosselin, B, Popovic, M, Rusch, LA. Flexible sixteen monopole antenna array for microwave breast cancer detection. In: 2014 36th Annual international conference of the IEEE engineering in medicine and biology society. IEEE; 2014:3775–8 pp.10.1109/EMBC.2014.6944445Search in Google Scholar PubMed
13. Sharma, N, Singh, HS, Khanna, R, Kaur, A, Agarwal, M. Development of deeply focused microwave lens applicator for efficient hyperthermia treatment. Optik 2022;259:168946. https://doi.org/10.1016/j.ijleo.2022.168946.Search in Google Scholar
14. Fear, EC, Li, X, Hagness, SC, Stuchly, MA. Confocal microwave imaging for breast cancer detection: localization of tumors in three dimensions. IEEE Trans Biomed Eng 2002;49:812–22. https://doi.org/10.1109/tbme.2002.800759.Search in Google Scholar PubMed
15. Davis, SK, Van Veen, BD, Hagness, SC, Kelcz, F. Breast tumor characterization based on ultrawideband microwave backscatter. IEEE Trans Biomed Eng 2007;55:237–46. https://doi.org/10.1109/tbme.2007.900564.Search in Google Scholar
16. Mahmud, MZ, Islam, MT, Misran, N, Kibria, S, Samsuzzaman, M. Microwave imaging for breast tumor detection using uniplanar AMC based CPW-fed microstrip antenna. IEEE Access 2018;6:44763–75. https://doi.org/10.1109/access.2018.2859434.Search in Google Scholar
17. Paul, LC, Hosain, MS, Sarker, S, Prio, MH, Morshed, M, Sarkar, AK. The effect of changing substrate material and thickness on the performance of inset feed microstrip patch antenna. Am J Network Commun 2015;4:54–8. https://doi.org/10.11648/j.ajnc.20150403.16.Search in Google Scholar
18. Sheeba, IR, Jayanthy, T. Design and analysis of a flexible softwear antenna for tumor detection in skin and breast model. Wireless Pers Commun 2019;107:887–905. https://doi.org/10.1007/s11277-019-06307-z.Search in Google Scholar
19. Hussain, MB, Butt, M, Nadeem, Z, Zahid, M, Amin, Y. Design of dual-band microstrip patch antenna for wireless local area network applications. Eng Proc 2023;46:2–7. https://doi.org/10.3390/engproc2023046003.Search in Google Scholar
20. Choudhury, S. Effect of dielectric permittivity and height on a microstrip-fed rectangular patch antenna. Int J Electron Commun Technol 2014;5:l29–130.Search in Google Scholar
21. Shokry, MA, Allam, AM. UWB antenna for brain stroke and brain tumour detection. In: 2016 21st International conference on microwave, radar and wireless communications (MIKON). IEEE; 2016:1–3 pp.10.1109/MIKON.2016.7491967Search in Google Scholar
22. Selvaraj, V, Baskaran, D, Rao, PH, Srinivasan, P, Krishnan, R. Breast tissue tumor analysis using wideband antenna and microwave scattering. IETE J Res 2021;67:49–59. https://doi.org/10.1080/03772063.2018.1531067.Search in Google Scholar
23. Al-Zuhairi, DT, Gahl, JM, Al-Azzawi, A, Islam, NE. Simulation design and testing of a dielectric embedded tapered slot UWB antenna for breast cancer detection. Prog Electromagn Res C 2017;79:1–5. https://doi.org/10.2528/pierc17080103.Search in Google Scholar
24. Tiang, SS, Hathal, MS, Zanoon, TF, Ain, MF, Abdullah, MZ. Radar sensing featuring biconical antenna and enhanced delay and sum algorithm for early stage breast cancer detection. Prog Electromagn Res B 2013;46:299–316. https://doi.org/10.2528/pierb12102201.Search in Google Scholar
25. Kobayashi, M, Sawada, N. Analysis and synthesis of tapered microstrip transmission lines. IEEE Trans Microwave Theory Tech 1992;40:1642–6. https://doi.org/10.1109/22.149542.Search in Google Scholar
26. Mahatmanto, BP, Apriono, C, Zulkifli, FY, Rahardjo, ET. Hexagonal triangular fractal antenna with tapered feedline and reflector for 5G and UWB applications. In: 2019 IEEE conference on antenna measurements & applications (CAMA). IEEE; 2019:1–4 pp.10.1109/CAMA47423.2019.8959773Search in Google Scholar
27. Kumar, N, Singh, KK, Badhai, RK. A tapered feed circular monopole super ultra-wideband (UWB) printed antenna. In: 2016 International conference on communication and signal processing (ICCSP). IEEE; 2016:1943–6 pp.10.1109/ICCSP.2016.7754510Search in Google Scholar
28. Ul Haq, MA, Koziel, S, Cheng, QS. On feed line modifications for compact wideband antenna design. In12th European Conference on Antennas and Propagation (EuCAP 2018). IET, Stevenage UK; 2018:282–5 pp.Search in Google Scholar
29. Azim, R, Islam, MT, Misran, N. Compact tapered-shape slot antenna for UWB applications. IEEE Antennas Wireless Propag Lett 2011;10:1190–3. https://doi.org/10.1109/lawp.2011.2172181.Search in Google Scholar
30. Engheta, N, Ziolkowski, RW. Metamaterials: physics and engineering explorations. Hoboken, New Jersey, USA: John Wiley & Sons; 2006.10.1002/0471784192Search in Google Scholar
31. Eleftheriades, GV, Iyer, AK, Kremer, PC. Planar negative refractive index media using periodically LC loaded transmission lines. IEEE Trans Microwave Theory Tech 2002;50:2702–12. https://doi.org/10.1109/tmtt.2002.805197.Search in Google Scholar
32. Attia, H, Yousefi, L, Bait-Suwailam, MM, Boybay, MS, Ramahi, OM. Enhanced-gain microstrip antenna using engineered magnetic superstrates. IEEE Antennas Wireless Propag Lett 2009:1198–201. https://doi.org/10.1109/lawp.2009.2035149.Search in Google Scholar
33. Foroozesh, A, Shafai, L. Investigation into the effects of the patch-type FSS superstrate on the high-gain cavity resonance antenna design. IEEE Trans Antennas Propag 2009;58:258–70. https://doi.org/10.1109/tap.2009.2037702.Search in Google Scholar
34. Veysi, M, Kamyab, M, Mousavi, SM, Jafargholi, A. Wideband miniaturized polarization-dependent HIS incorporating metamaterials. IEEE Antennas Wireless Propag Lett 2010;9:764–6. https://doi.org/10.1109/lawp.2010.2062170.Search in Google Scholar
35. Jafargholi, A, Jafargholi, A, Choi, JH. Mutual coupling reduction in an array of patch antennas using CLL metamaterial superstrate for MIMO applications. IEEE Trans Antennas Propag 2018;67:179–89. https://doi.org/10.1109/tap.2018.2874747.Search in Google Scholar
36. Jafargholi, A, Jafargholi, A, Choi, JH, Veysi, M, Soleimani, A. Microstrip patch back radiation reduction using metamaterial superstrate. IET Microwaves, Antennas Propag 2020;14:158–64. https://doi.org/10.1049/iet-map.2018.6237.Search in Google Scholar
37. Zhang, Y, Hong, W, Yu, C, Kuai, ZQ, Don, YD, Zhou, JY. Planar ultrawideband antennas with multiple notched bands based on etched slots on the patch and/or split ring resonators on the feed line. IEEE Trans Antennas Propag 2008;56:3063–8. https://doi.org/10.1109/tap.2008.928815.Search in Google Scholar
38. Wang, J, Qu, S, Xu, Z, Zhang, J, Ma, H, Yang, Y, et al.. Broadband planar left-handed metamaterials using split-ring resonator pairs. Photon Nanostruct: Fundam Appl 2009;7:108–13. https://doi.org/10.1016/j.photonics.2009.01.001.Search in Google Scholar
39. Islam, MT, Islam, MM, Samsuzzaman, M, Faruque, MR, Misran, N. A negative index metamaterial-inspired UWB antenna with an integration of complementary SRR and CLS unit cells for microwave imaging sensor applications. Sensors 2015;15:11601–27. https://doi.org/10.3390/s150511601.Search in Google Scholar PubMed PubMed Central
40. Yahya, R, Nakamura, A, Itami, M. Ultra-wideband FSS-based antennas. In: UWB technology and its applications. London, UK: IntechOpen; 2018.10.5772/intechopen.79888Search in Google Scholar
41. Din, IU, Ullah, S, Naqvi, SI, Ullah, R, Ullah, S, Ali, EM, et al.. Improvement in the gain of UWB antenna for GPR applications by using frequency‐selective surface. Int J Antennas Propag 2022;2022:2002552. https://doi.org/10.1155/2022/2002552.Search in Google Scholar
42. Pasian, M, Monni, S, Neto, A, Ettorre, M, Gerini, G. Frequency selective surfaces for extended bandwidth backing reflector functions. IEEE Trans Antennas Propag 2009;58:43–50. https://doi.org/10.1109/tap.2009.2036185.Search in Google Scholar
43. Korkmaz, E, Isik, O, Nassor, MA. A compact microstrip spiral antenna embedded in water bolus for hyperthermia applications. Int J Antennas Propag 2013;2013:954986. https://doi.org/10.1155/2013/954986.Search in Google Scholar
44. Singh, S, Sahu, B, Singh, SP. Conformal microstrip slot antenna with an AMC reflector for hyperthermia. J Electromagn Waves Appl 2016;30:1603–19. https://doi.org/10.1080/09205071.2016.1207568.Search in Google Scholar
45. Singh, M, Basu, A, Koul, SK. Circular patch antenna with quarter wave transformer feed for wireless communication. In: 2006 Annual IEEE India conference. IEEE; 2006:1–5 pp.10.1109/INDCON.2006.302847Search in Google Scholar
46. Balanis, CA. Antenna theory: analysis and design. Hoboken, New Jersey, USA: John Wiley & Sons; 2016.Search in Google Scholar
47. Pozar, DM. Microwave engineering. New York: John Wiley & Sons, Inc.; 1998:367–8 pp.Search in Google Scholar
48. Grover, P, Singh, HS, Sahu, SK. Design and analysis of a super compact UWB antenna for accurate detection of breast tumors using monostatic radar‐based microwave imaging technique. Int J Imaging Syst Technol 2023;33:2100–17. https://doi.org/10.1002/ima.22915.Search in Google Scholar
49. Zulfiker, MM, Islam, MT, Misran, N, Singh, MJ, Mat, K. A negative index metamaterial to enhance the performance of miniaturized UWB antenna for microwave imaging applications. Appl Sci 2017;7:1149. https://doi.org/10.3390/app7111149.Search in Google Scholar
50. Computer Simulation Technology (CST) microwave studio software. Available from: https://www.3ds.com.Search in Google Scholar
51. Grover, P, Singh, HS, Sahu, S. Simulation study of a compact UWB antenna for detection of breast tumors using microwave imaging technique. Int Conf Device Intell Comput Commun Technol 2023;1–4. https://doi.org/10.1109/DICCT56244.2023.10110104.Search in Google Scholar
52. Xu, Z, Zhu, S, Wang, R, Xie, R. An H-shape dielectric resonator antenna with U-slot on the patch. In: 2016 Progress in electromagnetic research symposium (PIERS), vol 8. IEEE; 2016:4447–50 pp.10.1109/PIERS.2016.7735647Search in Google Scholar
53. Recommended practice for measurements and computations of radio frequency electromagnetic fields with respect to human exposure to such fields, 100 kHz–300 GHz, IEEE Standard C95.3, 2002.Search in Google Scholar
54. International Commission on Non-Ionizing Radiation Protection. Guidelines for limiting exposure to time-varying electric, magnetic, and electromagnetic fields (up to 300 GHz). Health Phys 1998;74:494–522. https://doi.org/10.1049/cp.2018.0641.Search in Google Scholar
55. Mance, M, Bulic, K, Antabak, A, Miloševic, M. The influence of size, depth and histologic characteristics of invasive ductal breast carcinoma on thermographic properties of the breast. EXCLI J 2019;18:549. https://doi.org/10.17179/excli2019-1600.Search in Google Scholar PubMed PubMed Central
56. Campbell, AM, Land, DV. Dielectric properties of female human breast tissue measured in vitro at 3.2 GHz. Phys Med Biol 1992;37:193. https://doi.org/10.1088/0031-9155/37/1/014.Search in Google Scholar PubMed
57. Garrett, J, Fear, E. A new breast phantom with a durable skin layer for microwave breast imaging. IEEE Trans Antennas Propag 2015;63:1693–700. https://doi.org/10.1109/tap.2015.2393854.Search in Google Scholar
58. Onishi, T, Ishido, R, Takimoto, T, Saito, K, Uebayashi, S, Takahashi, M, et al.. Biological tissue-equivalent agar-based solid phantoms and SAR estimation using the thermographic method in the range of 3–6 GHz. IEICE Trans Commun 2005;88:3733–41.10.1093/ietcom/e88-b.9.3733Search in Google Scholar
59. Hartsgrove, G, Kraszewski, A, Surowiec, A. Simulated biological materials for electromagnetic radiation absorption studies. Bioelectromagnetics Journal of the Bioelectromagnetics Society, The Society for Physical Regulation in Biology and Medicine, The European Bioelectromagnetics Association 1987;8:29–36. https://doi.org/10.1002/bem.2250080105.Search in Google Scholar PubMed
60. Federal communications commission additional information for evaluating compliance of Mobile and portable devices with FCC limits for human exposure to radio frequency emissions. FCC OET Bulletin. 65, 2001 edition 01-01.Search in Google Scholar
61. Mobashsher, AT, Abbosh, AM. Artificial human phantoms: human proxy in testing microwave apparatuses that have electromagnetic interaction with the human body. IEEE Microwave Mag 2015;16:42–62. https://doi.org/10.1109/mmm.2015.2419772.Search in Google Scholar
62. Shenouda, MH, Fear, EC. Design of dielectric immersed tapered slotline antenna for radar‐based microwave breast imaging. Microwave Opt Technol Lett 2009;51:633–8. https://doi.org/10.1002/mop.24112.Search in Google Scholar
63. Singhwal, SS, Kanaujia, BK, Singh, A, Kishor, J. Novel circularly polarized dielectric resonator antenna for microwave image sensing application. Microwave Opt Technol Lett 2019;61:1821–7. https://doi.org/10.1002/mop.31830.Search in Google Scholar
64. Huang, W, Kishk, AA. Compact dielectric resonator antenna for microwave breast cancer detection. IET Microwave, Antennas Propag 2009;3:638–44. https://doi.org/10.1049/iet-map.2008.0170.Search in Google Scholar
65. https://www.health.com/mind-body/6-key-medical-scans-and-what-they-should-cost.Search in Google Scholar
66. Sharma, N, Singh, HS, Khanna, R, Kaur, A, Agarwal, M. Development of metasurface based hyperthermia lens applicator for heating of cancerous tissues. Biomed Eng Lett 2024;14:1–2. https://doi.org/10.1007/s13534-023-00300-z.Search in Google Scholar PubMed PubMed Central
© 2025 the author(s), published by De Gruyter, Berlin/Boston
This work is licensed under the Creative Commons Attribution 4.0 International License.