Experimental testing and finite element analysis of polyurethane adhesive joints under Mode I loading and degradation conditions
-
Cristina Alía
 ,
Juan Carlos Suárez-Bermejo
,
Juan Carlos Suárez-Bermejo

Abstract
The use of adhesive joints in marine environments for extended periods and under adverse environmental conditions leads to accelerated adhesive degradation. Therefore, this study aims to perform a dual analysis, both experimental and FEM, based on steel–polyurethane–steel adhesive joints to evaluate their fracture behaviour in Mode I under degradation conditions caused by accelerated polymer aging, due to the combined effects of moisture (seawater immersion) and high temperature (50°C). Experimental tests provided insights into the moisture concentration profiles within polyurethane, determining its critical concentration (0.61%) and diffusion coefficient (5.105 × 10⁻¹³ m2·s−1). Additionally, the variation curve of fracture energy versus elongation and the cohesive behaviour law of polyurethane were obtained (maximum stress of 0.32 MPa with a deformation of 0.02 mm). These experimental results enabled the development of an FEM analysis of the polyurethane adhesive joint, allowing for the simulation of the polyurethane–steel interface behaviour under adverse environmental conditions and constant Mode I loading. This approach makes it possible to predict both the failure moment and failure mode of the joint.
1 Introduction
Adhesive joints are frequently used in industrial applications due to their numerous advantages over traditional joining methods such as welding or riveting. Among these advantages, adhesives offer the ability to bond different materials with irregular surfaces, reduce weight, distribute stresses more uniformly, provide sealing properties, and prevent galvanic corrosion.
This behaviour has led to the widespread use of adhesive joints in the maritime industry, particularly in the manufacturing of structural laminated materials for marine applications. For example, in the hybrid material Malecon (1), adhesives play a crucial role. This material consists of a three-layer sandwich structure (steel, fibreglass composite with vinyl ester resin, and steel), which is bonded together using polyurethane adhesive. Thus, structural adhesive is present both in the composite material (vinyl ester resin) and in joints between the composite and steel (polyurethane).
The use of this type of material in a marine environment for extended service under adverse environmental conditions (i.e., humidity, temperature, and chloride ion concentration) leads to accelerated degradation of polyurethane adhesives (2). This degradation reduces their mechanical performance, weakening the joint and potentially causing premature adhesive failure (3,4,5,6).
In general, water (in the liquid or vapour phase) diffuses into the adhesive, reducing the durability and reliability of the joint. Exposure to water alters the physical and chemical properties of the adhesive, leading to the deterioration of the adhesive layer due to plasticization, swelling, degradation, cracking, and crazing (7).
The combined effect of moisture and temperature has an even greater impact on the premature deterioration of adhesive joints. At temperatures above the glass transition temperature of the adhesive and under high relative humidity, the mechanical properties of the adhesive decrease drastically due to significant moisture absorption (8).
Furthermore, this deterioration process is further accelerated when mechanical loads are applied under adverse environmental conditions. Several studies (9,10) have analysed the mechanical properties of degradation in adhesive joints exposed to a combination of temperature, humidity, and constant loads, replicating typical working conditions in engineering applications.
In marine structures, adhesive joints are subjected to highly aggressive environmental conditions and permanent variable loading, leading to a significant reduction in their mechanical properties over time. As a result, various accelerated ageing test methods have been developed to simulate the degradation process of adhesives in marine environments (11,12). For example, in steel–polyurethane–steel joints immersed in seawater for 7 days and subsequently subjected to seven loading modes (ranging from 0°C to 90°C) at 50°C, it was observed that although progressive degradation occurs, the joints exhibit better performance under shear load (Mode II) (13). Similarly, steel–vinyl ester–steel joints under similar conditions also showed better performance in this loading mode (14).
In some studies, experimental research on the mechanical degradation of structural adhesive joints is complemented by finite element modelling (FEM). FEM allows for both the validation of experimental results and the development of a predictive model for the mechanical behaviour of adhesive joints. In this regard, Costa et al. (15) proposed an FEM simulation based on cohesive element modelling of an adhesive joint subjected to degradation due to moisture and fatigue using Abaqus software. Furthermore, Han et al. (16) analysed the hygrothermal degradation of adhesive joints immersed in saltwater through three-point bending tests, proposing a two-phase FEM approach: simulation of the water diffusion process in the adhesive and simulation of the bending test.
Following this approach, the present study aims to perform a dual analysis (experimental and numerical) of steel–polyurethane–steel adhesive joints to evaluate their fracture behaviour in Mode I under degradation conditions caused by accelerated polymer ageing due to the combined effects of moisture (seawater immersion) and high temperature (50°C).
To perform the Mode I creep test, a standardized mixed cantilever beam (MCB) specimen was used, as its geometry is well suited to obtain the cohesive behaviour law of the adhesive and its fracture energy (17,18). The stability and flexibility of these specimens allowed for easy measurement of deformations over time during the constant-load creep test.
Based on the experimental data obtained, an FEM model of the polyurethane adhesive joint was developed using Abaqus software. This model enabled both the validation of the experimental measurements and the simulation of the behaviour of the polyurethane-steel interface under adverse environmental conditions when subjected to constant Mode I loading. This approach allows for predicting the limit state of the adhesively bonded joints.
In summary, the main novelty of this work is to demonstrate that the developed FEM has the ability to predict the mechanical behaviour of adhesive joints subjected to environmental degradation, specifically due to moisture diffusion and seawater immersion. Therefore, the main objective of the present work was to perform a dual analysis, experimental and FEM simulation, of steel–polyurethane–steel adhesive joints to evaluate their mechanical fracture behaviour in Mode I (through creep testing) under accelerated ageing conditions of the polymer due to the combined action of moisture (immersed in seawater) and high temperature (50°C).
2 Adhesive fracture and cohesive behaviour laws
Determining the stresses acting on an adhesive joint under service conditions and determining the maximum admissible force is a complex problem, particularly when typical anomalies in adhesive joints are present. In such cases, fracture mechanics is an appropriate approach, as the maximum stress in a material is determined by stress enhancement at discontinuities. Although fracture mechanics models are more complex than other methods, they are more reliable and efficient for studying structural adhesive joints (19).
Adhesive bond joints typically operate under mixed-mode loading, which means a combination of peel stress (Mode I) and shear stress (Mode II). Simplified analysis of adhesive joints can be performed in terms of normal stress (σ), shear stress (τ), normal deformation (w), and shear deformation (v), both in the adherents and in the adhesive (19). Figure 1 illustrates the stress distribution in a thin adhesive layer.

Stresses and strains in a thin adhesive layer.
In these simplified studies, the adhesion layer theory can be applied, which states: “If the strain gradient along the adhesive layer is zero, then the adhesive state is homogeneous, except in small regions at the free boundaries of the adhesive layer” (20).
A criterion for validating the application of the adhesive layer theory is that the process zone must be large compared to the adhesive layer thickness. If this condition is met, fracture mechanics can be applied using a single loading parameter, such as fracture energy (J c). Otherwise, strain gradients along the layer thickness must be considered.
By applying the adhesive layer theory, the macroscopic mechanical properties of an adhesive layer can be described through constitutive relationships, which express the stress state as a function of the deformation of the adhesive layer. This relationship is assumed to be independent of the material and properties of the adherents.
Under constant loads, the stress initially increases until it reaches a value where plasticization begins, leading to damage and progressive degradation of stiffness. Eventually, the deformation increases to a critical value Δ c, and the energy dissipation in the fracture process zone (FPZ) reaches a threshold value, known as the fracture energy (J c), which corresponds to the area under the curve. Beyond this critical point, crack propagation occurs, forming new fracture surfaces.
This behaviour is illustrated in Figure 2, which shows the stress state as a function of adhesive deformation for the Mode I test.
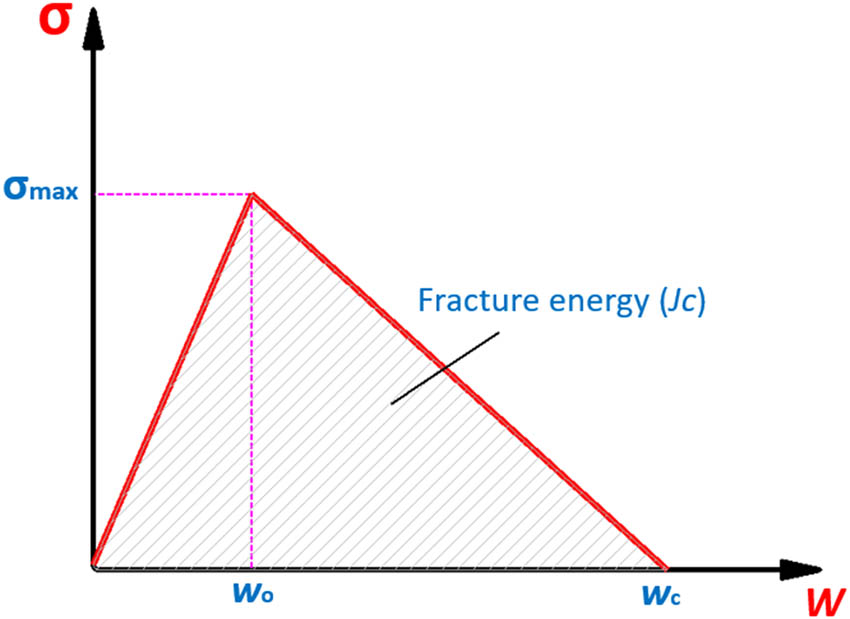
Stress state as a function of adhesive deformation for Mode I with indication of critical deformation and stress.
For adhesive joints, the constitutive relationship represents the mechanical behaviour of the entire adhesive layer. These relationships describe the behaviour of the adhesive layer before and after fracture. Mathematically, the constitutive relationship can be represented by “traction-separation” models, also known as cohesive laws. These laws have been used to model the initiation and propagation of cracks in the adhesive layer and to determine its behaviour. Högberg et al. (21) and Sørensen and Kirkegaard (22) developed an approach based on the J-integral (to determine cohesive laws) and constitutive behaviour (to describe the stress–strain relationship in the adhesive layer).
To obtain the essential behaviour of an adhesive layer experimentally, it is convenient to consider just one area of the process in the tested adhesive layer. This can be achieved by setting the sample load at one edge of a sufficiently long specimen. As a result of the elasticity of the adhesive layer, the edge of the sample will be virtually unloaded. Thus, a reasonably long sample, such as MCB samples, can be considered as semi-infinite in the analysis. In this work, MCB specimens are used to undergo peel stress, and integral-J is used to assess the energy dissipation in the crack process area. The design and testing were based on the use of MCB specimens in composite mode. This specimen configuration, initially proposed by Högberg et al. (21) and further developed by Suárez et al. (19) offers several advantages over other configurations commonly employed in the study of environmental degradation of adhesive joints.
Figure 3 shows the MCB specimen as a basic load system overlay. Every adherent is loaded into the free part with the same magnitude force, F, but in the opposite direction. These forces have a definite direction of action defined by angle α (90° in Mode I).
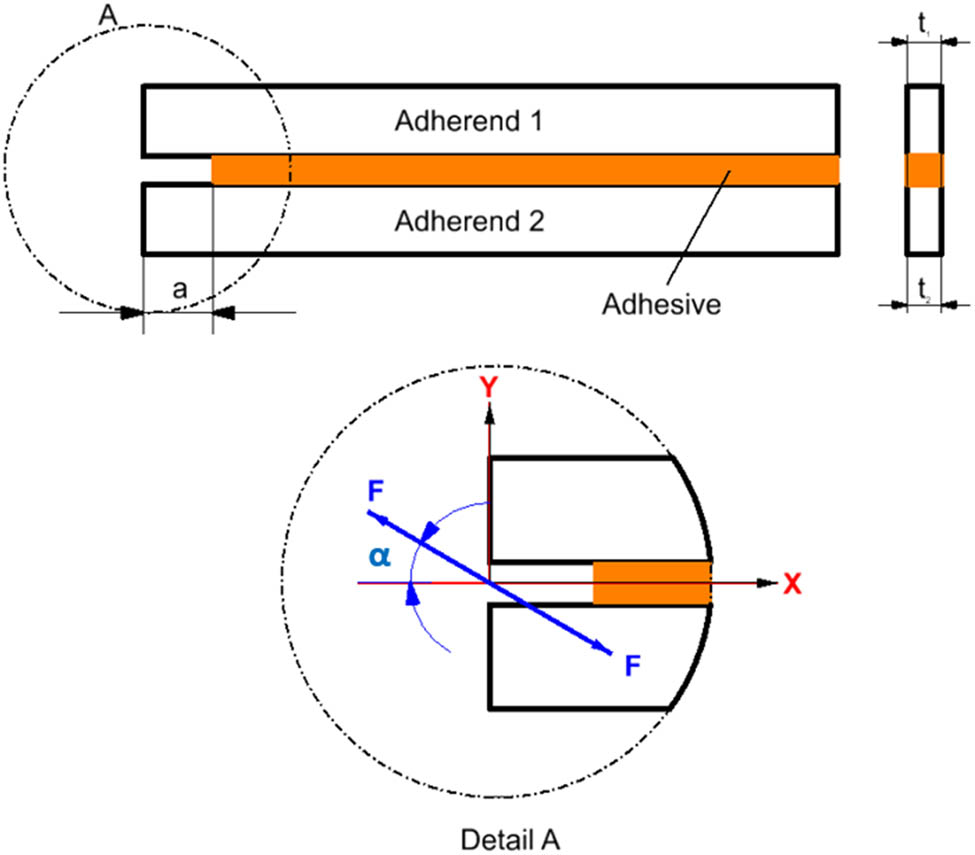
Peel stress in double cantilever beam (DCB) test specimens.
As the deformation of the adherends is elastic under the action of the load that produces small dimensional modifications, the rotations of the substrates at the tip of the crack can be calculated with the following equations:
where u x,i is the displacement in the direction x and u y,i is the coordinate in the direction y of point i, where i = 1, 2, 3, and 4 (Figure 4).
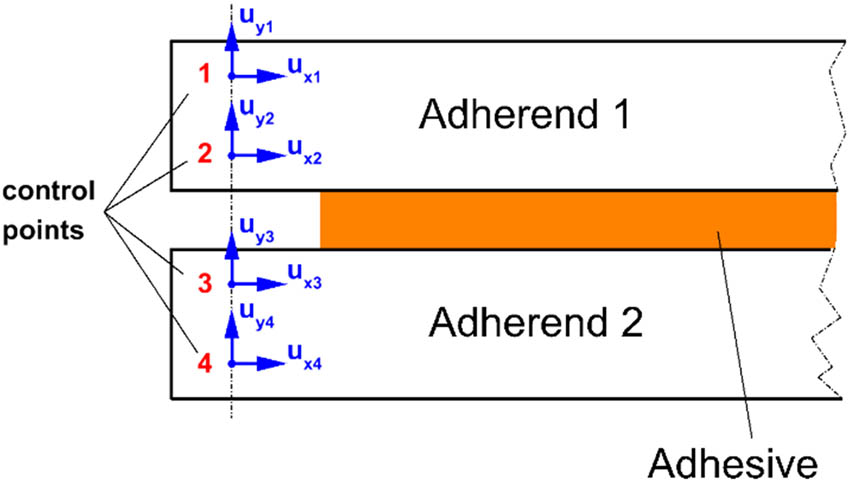
Displacements at the control points and rotations of the adherends.
Once these strains are known and based on the applied force, the crack energy is obtained using the following equation (19,23):
where J is the crack energy, F is the force of the free part of the sample to be loaded with, α is the torque application angle (90° in mode I), b is the width of the sample.
Given the normal fracture energy, the normal and shear stresses supported by the adhesive are derived by applying the inverse method suggested by Högberg (23):
The cohesive behaviour of the adhesive layer (relationship stress/strain) is represented by a simplified sawtooth shape curve (Figure 2). Therefore, the dimensionless magnitude of the deformation (Δ) is obtained by the following equation:
where w̄ and v̄ are the normal and tangential strains, respectively.
3 Materials and methods
3.1 Materials and surface preparation of adherents
Cold-rolled steel was used as an adherent in plates 1,000 × 100 × 10 mm3. Its chemical composition, similar to that of ordinary carbon steel, is shown in Table 1. The adhesive used was a two-component polyurethane (RE 11820-9 from AXSON), with properties shown in Table 2.
Chemical composition of cold-rolled steel
| Component | Quantity (%) |
|---|---|
| Carbon | <1% |
| Manganese | <0.9% |
| Silicon | <0.5% |
| Phosphorus | <0.1% |
| Sulphur | <0.1% |
Properties of polyurethane adhesive
| Property | Polyurethane RE 11820-9 |
|---|---|
| Tensile strength (MPa) | 6 |
| Elongation at break (%) | 120 |
| Viscosity at 25°C (mPa·s) | 4,500 |
| Pot life at 25°C (min) | 10 |
The surface preparation of the steel adherends began with cleaning using methyl ethyl ketone, followed by drying with absorbent paper. An abrasive treatment was then applied to the surface by sandblasting with 120 µm alumina grains (Euroblast 2SF machine from Guyson). The adherents were then immersed in an aqueous solution (660 ml of phosphoric acid and 1,340 ml of alcohol) for ultrasonic cleaning for 30 min at 30°C (Nessler model machine). After this cleaning, the parts were immersed in distilled water. Finally, the adherends were cleaned with methyl ethyl ketone and dried with absorbent paper.
3.2 Preparation of steel–polyurethane–steel specimens
A 10 mm-wide strip of adhesive tape was placed along the longest side of one of the adherents' sandblasted surfaces. This non-stick material was used to prevent adhesion in this 10 mm wide area. Next, 1 mm-thick brass gauge plates were placed at the end of the adherend to ensure that when the polyurethane adhesive was applied, a uniform adhesive thickness (1 mm) would be obtained. After the adhesive was applied, the other steel adherend was placed on the top. A 15 N weight was then applied during the curing time (24 h at an ambient temperature of 25°C and 50% RH). Finally, the adhesively bonded plate was cut using a band saw to obtain the specimens for testing. These steel–polyurethane–steel specimens have a 1 mm-thick adhesive layer and dimensions of 4 × 100 × 10 mm3 for each steel substrate. To facilitate attachment to the testing fixture, a 4 mm-diameter hole was drilled in each steel substrate of the specimen. Figure 5 shows the specimen after the preparation process.
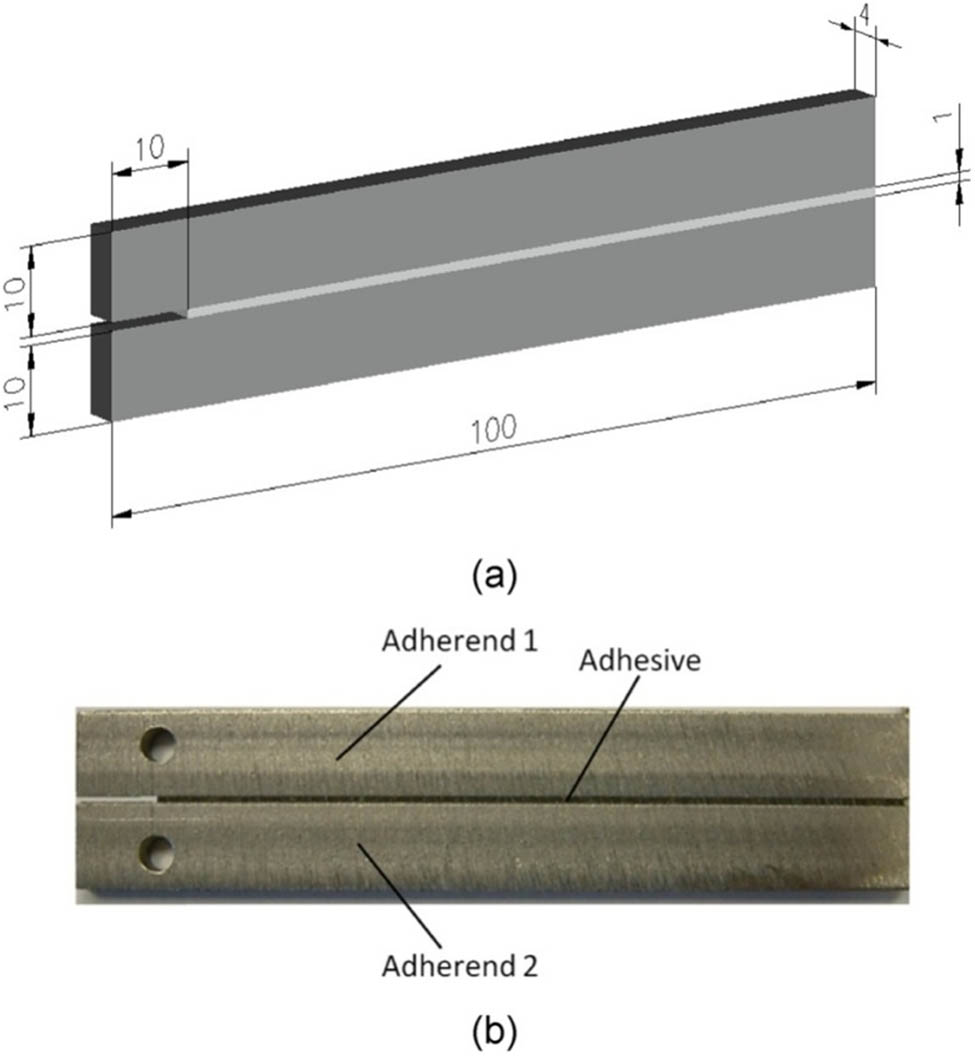
Dimensions (a) and image of a prepared specimen for testing (b).
3.3 Ageing by immersion in seawater
Polyurethane, like many other polymers, has intrinsic chemical resistance to water; that is, surface degradation resulting from water absorption in the presence of oxygen is not significant. However, polyurethane is not completely hydrophobic and can absorb water on its surface, which then diffuses into its interior. The mobility of water, or diffusion, is fundamentally dependent on the chemical nature of the polymer's bonds, the temperature, and the pH of the aqueous medium. If the percentage of water absorbed by the polymer is small, Fick’s second law is typically applied to determine the diffusion coefficient of water in the polymer. Once this value is known, a second analysis is conducted to determine the variation in the properties of the polymer experiences after exposure to environments with high relative humidity for prolonged service periods.
In this regard, a preliminary test was conducted to determine the seawater diffusion coefficient in the polyurethane adhesive. Polyurethane adhesive specimens were immersed in natural seawater for different periods of time. The bulk polyurethane adhesive specimens had dimensions of 1.5 × 15 × 80 mm3 and were cured at ambient temperature (25°C) for 24 h. After curing, the samples were immersed in containers with seawater from the Santander Bay (Spain), with a pH of 8.2. The samples were kept in containers at room temperature (25°C) for independent periods of 1, 2, 3, 8, 16, 32, 64, and 180 days. Each container contained at least three bulk adhesive specimens.
Once the immersion period for each container was complete, the samples were dried to partially remove the water absorbed by the polymer. Drying was carried out by heating the specimens to 40°C in a vacuum oven (0.053 atm). Water that is chemically bound to the polar groups of the polymer will remain after vacuum drying and will be responsible for the long-term degradation of the mechanical properties of the adhesive. Water that is not chemically bound temporarily modifies the polymer's properties, but after removal of the water during vacuum drying, these properties are recovered.
The amount of water absorbed by the adhesive was determined by gravimetric analysis using an electronic balance with an accuracy of 0.0001 g (model SARTORIUS TE 214S). The values obtained allow for the determination of the seawater diffusion coefficient in the polyurethane adhesive.
Similarly, the steel–polyurethane–steel samples were also immersed in a container with seawater from the Santander bay for a period of 7 days at ambient temperature (25°C).
3.4 Creep test in Mode I
After immersion in natural seawater, the steel–polyurethane–steel specimens were placed in a climatic chamber equipped with a creep testing station for different loading modes (13). In this study, the samples were subjected to creep loads in Mode I (the most demanding for the adhesive) at a temperature of 50°C. Several authors have considered 50°C to be an appropriate environmental temperature to age the adhesive, effectively simulating the adverse conditions experienced during service (22,23).
To determine the load to be applied during the creep tests in mode I, the maximum strength of the adhesive joint (σR) was determined through a tensile test. A testing machine with a 2 kN load cell and a displacement speed of 2 mm·min−1 (Ibertest IBTH3630 model) was used to determine the failure load (1.36 MPa) and displacement (6.23 mm). For the creep test, a load corresponding to 50% of the failure strength was chosen, that is, 0.68 MPa (122.5 N). Figure 6 shows the specimen prepared for the creep test in Mode I within the climatic chamber (accuracy of the load cell is ±1 N).
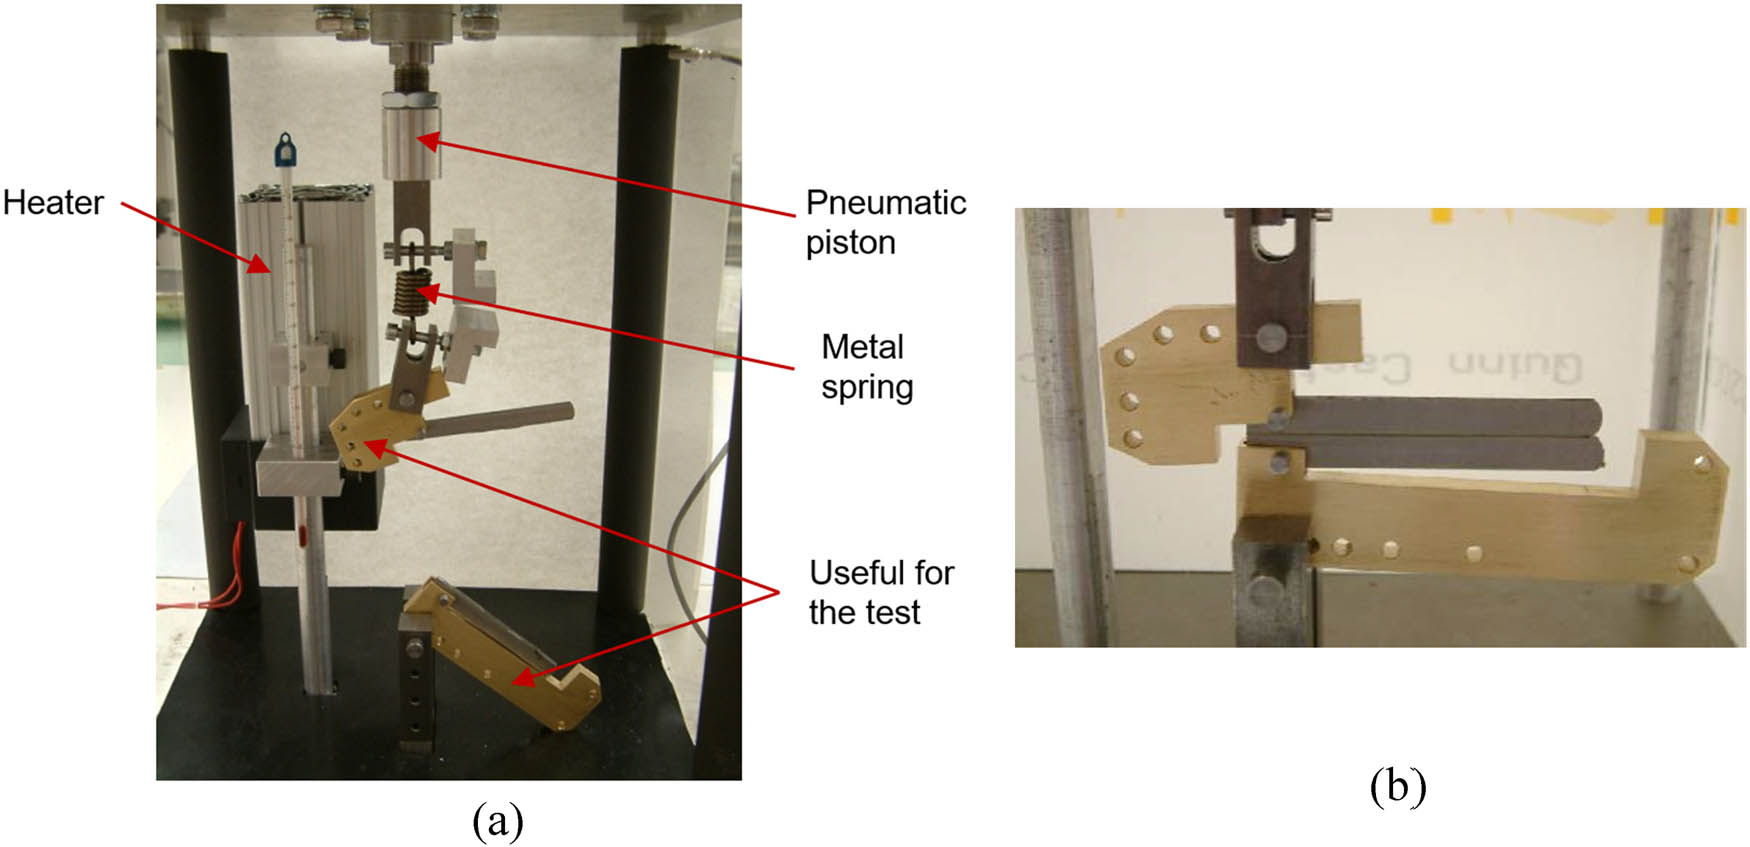
Climatic chamber for testing (a) and specimen prepared for Mode I testing (b).
An extensometer measured the displacements of a spring inside the chamber connected to the piston, which is sent to the control system. To set a load value for the test, a dial indicator was used. The relative temperature and humidity of the chamber were measured by a thermohygrometer. The temperature and relative humidity probes located in the chamber sent the collected data to the control and regulation system to process the signal. The probe was attached to the tools using the holes that define the required test mode. In addition, the upper part of the tool was connected to the spring by a screw, and the bottom part of the tool was attached to the base of the chamber by a screw.
A digital image correlation system, comprising a digital camera and software, was used to measure the displacements of the adhesive layer. The digital camera was an 8-bit Marlin F-146B IRF (Adept Electronic Solutions, Sydney, Australia) with a 1/2" progressive CCD sensor, a frame rate of 15 fps, and a lens mount of 25 mm. To analyse the data, Vic-2D software (Correlated Solutions, Inc.; Irmo, SC, USA, 2010) was used. This image correlation system provides a resolution of 1,392 × 1,040 pixels with a pixel size of 4.65 × 4.65 μm2; thus, it can provide accurate measurements in polyurethane tests because the displacements are in the range of several millimetres.
4 Test results and discussion
4.1 Degradation of polyurethane adhesive immersed in seawater
The gravimetric results obtained from the polyurethane adhesive specimens submerged in seawater show that their weight increases linearly during the first days of immersion due to water absorption by the adhesive. From the ninth day of immersion onwards, the weight of the specimens begins to decrease, indicating the occurrence of degradative phenomena within the polymer. This process starts immediately after immersion in water and ultimately leads to bond rupture and the loss of polymer fragments that are released into the aqueous medium, a clear sign of polyurethane degradation (hydrolytic degradation).
The maximum concentration of water in polyurethane is termed a “critical concentration.” In this case, it was reached on the ninth day and has a value of 0.61%. The linear growth zone of the concentration variation as a function of immersion time (the first nine days) is used to calculate the diffusion coefficient. The diffusion coefficient was found to be 5.105 × 10⁻¹³ m2·s−1.
Considering that water diffusion in this polymer follows Fick’s law, the diffusion coefficient allows the estimation of the time it takes for water to diffuse to the centre of the adhesive bond line, as well as the time needed for the water concentration in the central region to exceed the critical value above which irreversible damage occurs, resulting in the permanent loss of mechanical properties in the joint.
The critical water concentration shown in Figure 7 corresponds to the moisture level at which irreversible degradation of the polymer’s mechanical properties begins. This value was determined based on the water concentration profiles as a function of immersion time, calculated using Fick’s law and considering the geometry of the MCB specimens. By analyzing these profiles, the time required for the centre of the specimen to reach the critical concentration was estimated. For polyurethane, this time is 180 days, which means that it takes 180 days for the centre of the adhesive specimen to reach the critical moisture level, which is sufficient to cause irreversible damage to the polymer's properties. For polyurethane, this time is 180 days, which means that it takes 180 days for the centre of the adhesive specimen to reach the critical moisture level, which is sufficient to cause irreversible damage to the polymer's properties.
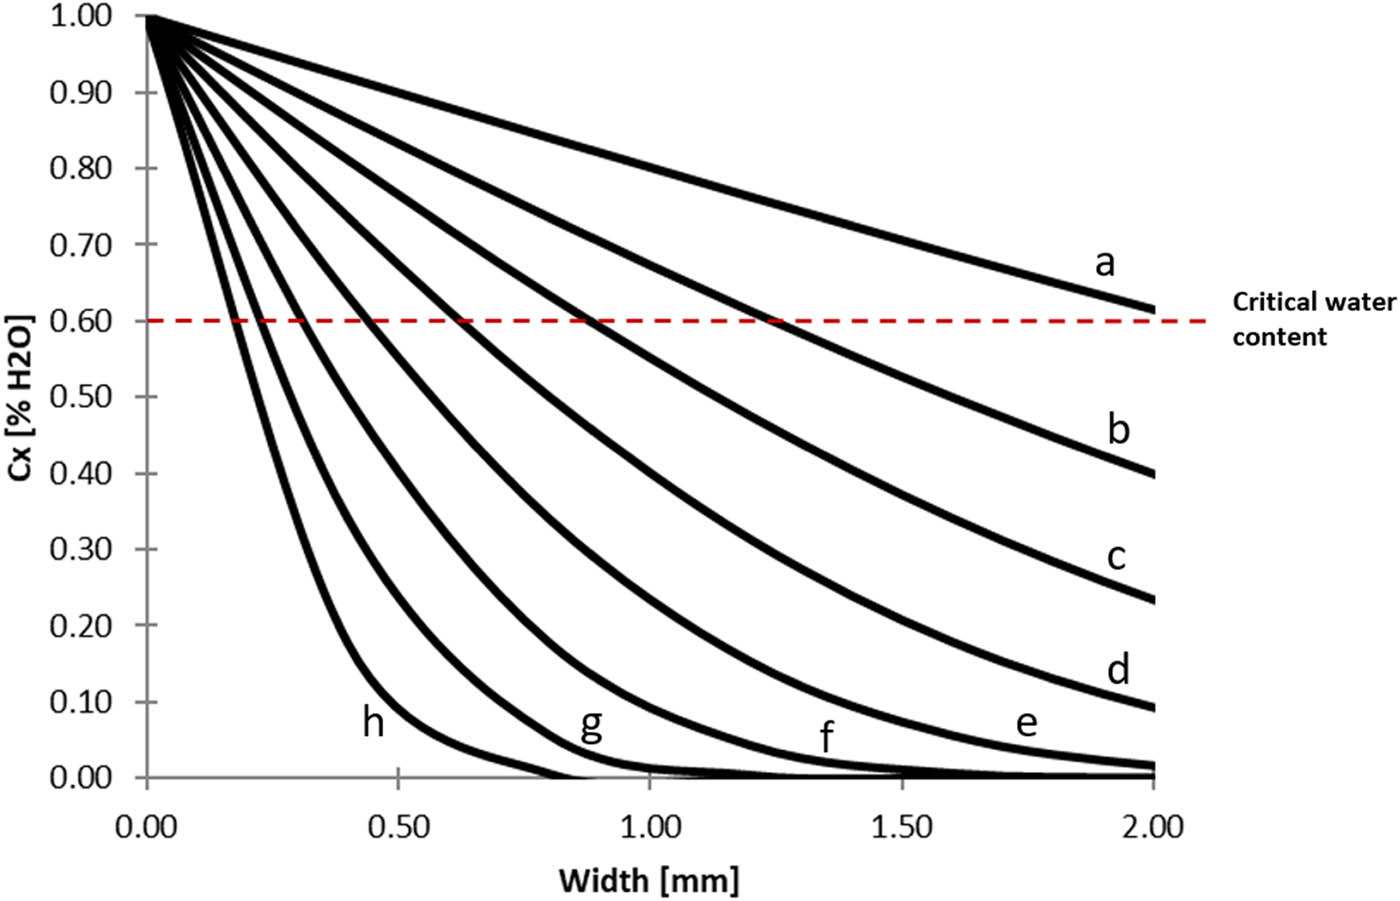
Water concentration profiles as a function of immersion time: (a) 180 days, (b) 139 days, (c) 64 days, (d) 32 days, (e) 16 days, (f) 8 days, (g) 4 days, and (h) 2 days.
4.2 Fracture test of the adhesive joint in Mode I
The adherents are loaded at the free end with a tension of 0.68 MPa (50% of the fracture load) using a pair of forces of the same direction and magnitude, but opposite senses, to load the test specimen in Mode I (α = 90°).
The parameters measured during the tests were the following: applied force F, adherent rotation,
The displacements in the x and y directions of four control points relative to the previously fixed coordinate system were measured using image correlation, producing u x1, u y1, u x2, u y2, u x3, u y3, u x4 and u y4, where u xi is the displacement in the x direction and u yi is the displacement in the y direction of point i, where i = 1, 2, 3, and 4. Therefore, the shear and peeling displacements of the adhesive layer, v and w, are obtained by the following equations:
In Figure 8(a), the shear deformation is plotted against the normal deformation (in mm). It can be observed that the deformation in the v direction is smaller than in the w direction, which means that the deformation occurring along the vertical axis is greater than that along the horizontal axis since this is a Mode I test (peeling). In Figure 8(b), the normalized deformation pattern is shown, which is very useful when comparing different loading modes.
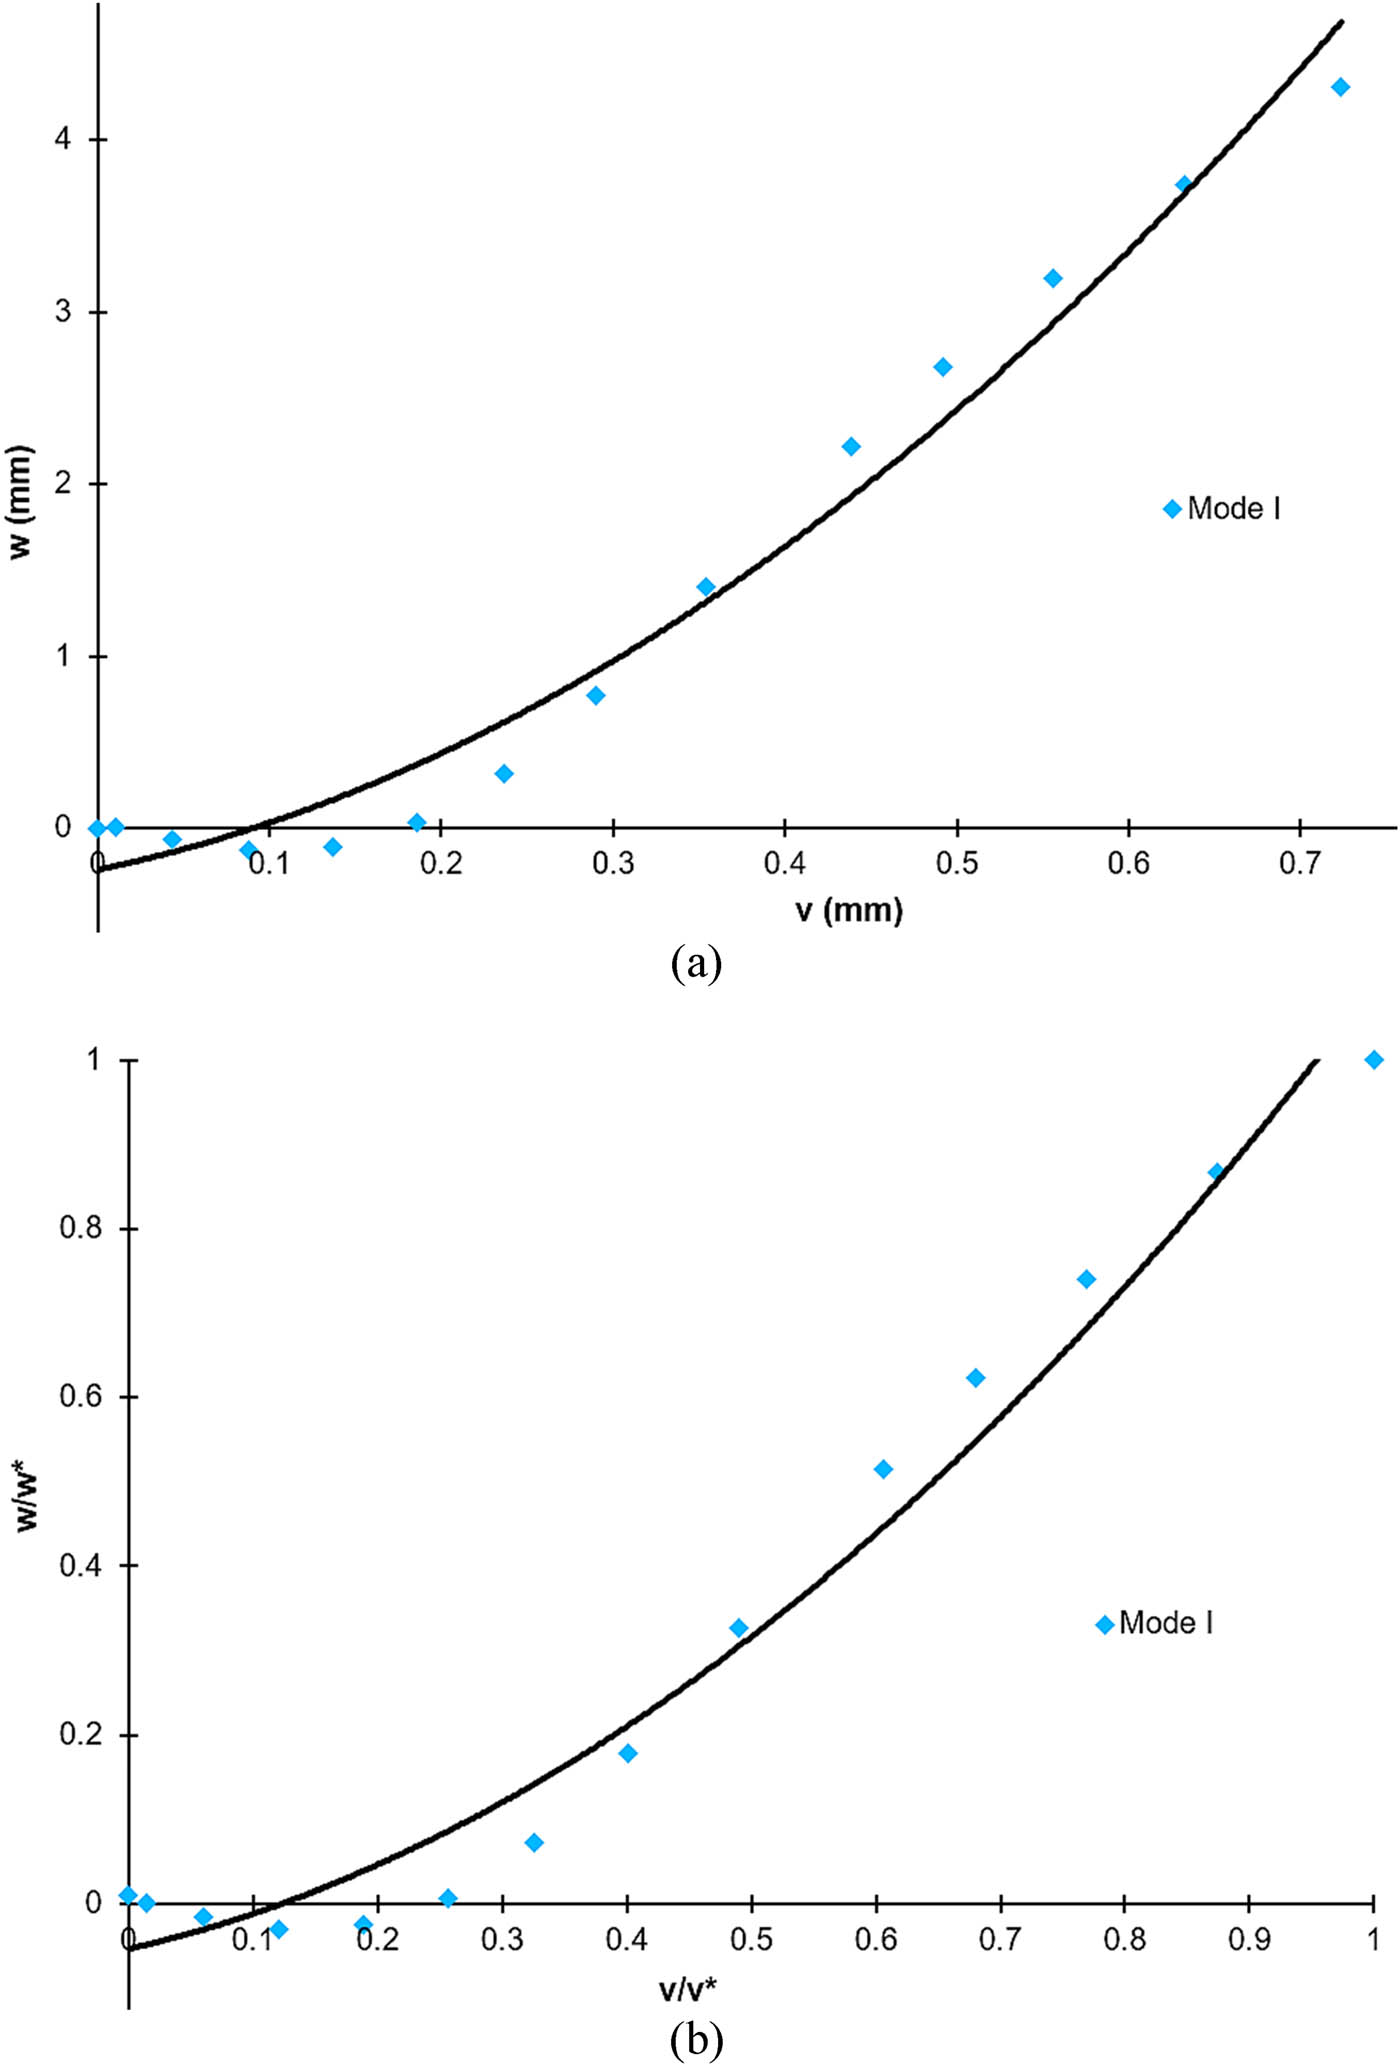
(a) Deformation trend for the polyurethane adhesive tested in Mode I at 50°C and 7 days of immersion in seawater and (b) its corresponding normalized curve.
Taking into account the values of the rotations of the adherents and the applied force, Eq. 3 can be applied to calculate the fracture energy. In Figure 9, the fracture energy is plotted as a function of the elongation given by Eq. 6.
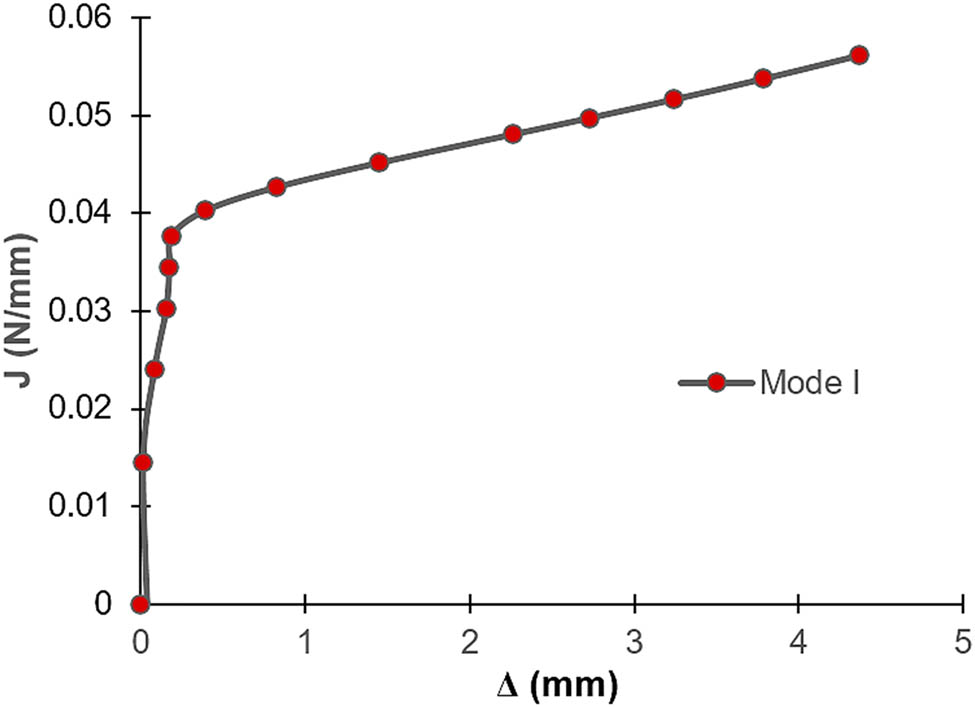
Fracture energy curve versus elongation for the Mode I test at 50°C with polyurethane adhesive after 7 days of immersion in seawater.
In Figure 10, the cohesive behaviour law of the polyurethane adhesive is shown for the Mode I test at 50°C after 7 days of immersion in seawater. A tension peak (0.32 MPa) is observed corresponding to the critical deformation (0.02 mm), followed by a progressive decrease in tension until it becomes nearly zero.
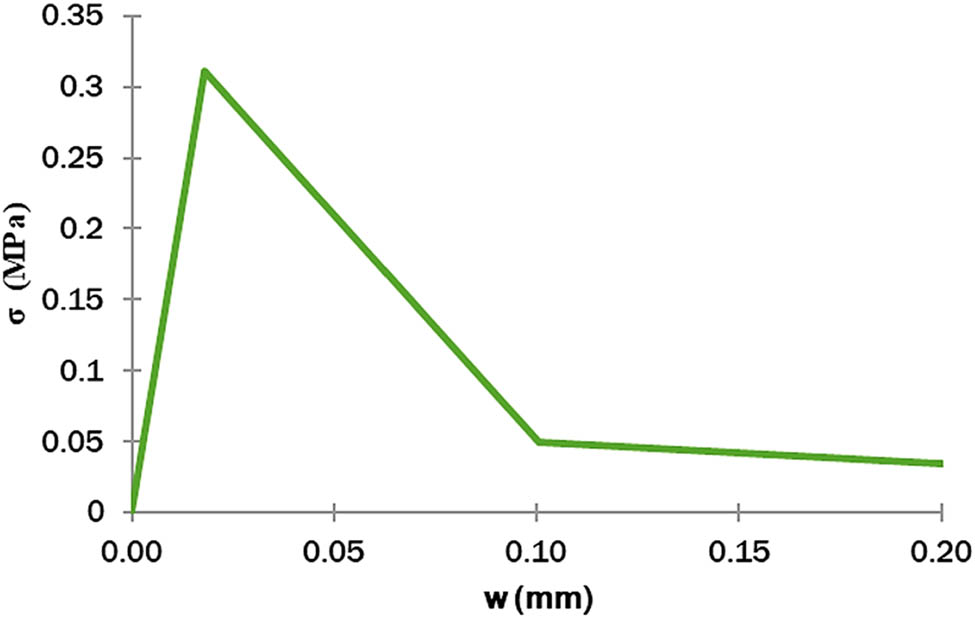
Cohesive behaviour law of polyurethane for the Mode I test at 50°C after 7 days of immersion in seawater.
The results obtained in this study are consistent with previously reported findings in the literature regarding the mechanical behaviour and environmental degradation of adhesive joints. For example, Banea et al. (24) highlighted the sensitivity of structural adhesives to moisture and temperature phenomena, also observed in this work, where water absorption leads to hygroscopic expansion and the generation of internal stresses. The modelling approach used aligns with that proposed by da Silva et al. (25), who developed and validated FEM strategies to predict failure in adhesive joints under various loading and environmental conditions. Regarding the experimental methodology, the use of standard fracture mechanics tests such as DCB and ENF is comparable to the procedures described by Borg et al. (26), further reinforcing the reliability of the validation process used in this work. Additionally, the degradation trends observed as a function of immersion time are consistent with the review of aging effects in adhesives conducted by Baldan (27), supporting the applicability of the proposed model for long-term durability assessment.
5 FEM of the polyurethane adhesive joint
Despite decades of development and modelling of adhesive joints, this remains a highly active research area. Since the first studies in this field by Wooley and Corver (28) in 1971 and Adams and Peppiatt (29) in 1974, knowledge about adhesives has evolved to the present day, where much of the effort is focused on studying the durability of joints from the perspective of fracture mechanics. The concepts of linear elastic fracture mechanics (LEFM), combined with finite element analysis (FEA), provide a practical and efficient way to study the fracture characteristics of adhesive joints.
For the FEA of adhesive joints, it is necessary to consider that the adherents are modelled as Euler–Bernoulli beams, while the adhesive layer is represented using interface elements. Since the constitutive relationships in adhesive joints describe the mechanical behaviour of the entire adhesive layer, various cohesive zone models have been studied in the literature using FEA. The two main models are the continuous cohesive zone model (CCZM) and the discrete cohesive zone model. In recent years, these models have been incorporated into commercial finite element software, such as Abaqus (30).
CCZMs, based on cohesive laws (or traction separation), have been widely used to analyse the decohesion of composite structures (31,32,33,34). However, continuous cohesive zone elements exhibit sensitivity to meshing issues, leading to convergence problems in the softening region of the cohesive law curve. In this region, stress decreases along with displacement, and this decrease is influenced by the aspect ratio of the cohesive behaviour curve. On the other hand, the discrete cohesive zone model (DCZM) appears to be a promising alternative to the CCZM method (26,35,36,37,38). The discrete cohesive zone methodology treats the process zone as discrete springs between pairs of nodes on adjacent surfaces. This method is extended to the entire nodal space and is independent of the mesh.
It is crucial to assess how the model and the assumed data reduction influence fracture predictions in a finite-element model. The most important parameters that define the cohesive law are fracture energy and stress in each fracture mode. Although determining the fracture energy and stress is essential for modelling the behaviour of certain adhesives, it is also necessary to consider the assumptions made when calculating these values from the experimental data. All data reduction techniques make assumptions about the experimental framework; however, these assumptions may not always be correct. For example, it is often assumed that the Mode II fracture energy can be determined from the ENF test independently of other tests. If the assumptions do not accurately reflect real behaviour, traditional methods of mapping experimental results to numerical implementation may yield poor parameter sets for subsequent use in predictive finite element models.
Some of the commonly used experiments to determine adhesive parameters include the DCB, end-notched flexure (ENF), and single lap joint (SLJ) tests, each used to determine a specific constitutive parameter (DCB for J IC, ENF for J IIC, and SLJ for J IIC).
A key uncertainty in experiments is the cohesive response of the adhesive. The exact form of the constitutive relationship is not easily determined and is often assumed or simplified, although there is little physical justification for this assumption, as noted by Högberg et al. (21). Constitutive uncertainty includes all parameters that define the shape (e.g., J c and stress), and these parameters are what the experiments aim to determine (22).
There is also uncertainty about the geometric characteristics of the specimens, such as the progression of the crack length. These challenges multiply when characterizing the fracture energy under mixed-mode loading conditions in adhesive joints. The most commonly used specimens for this characterization are cracked lap shear (CLS) and mixed-mode bending (MMB). However, in mixed-mode loading, difficulties arise in generating a broad range of mode ratios, and different types of specimens are required to obtain reliable results for Mode I, Mode II, or mixed-mode loading conditions.
For this reason, numerous studies have been conducted using finite element simulations to calculate fracture energy and determine whether physical observations are consistent. For example, Choupani (39) performed FEA on samples with different adherents to determine the fracture resistance for various substrates under mixed-mode loading, examining the relationship between stress intensity factors and fracture resistance. In this case, Arcan-type specimens were used.
Sutton et al. (40) also used Arcan specimens in their experimental and theoretical study on a fracture criterion based on crack opening displacement (COD) to characterise stable crack growth under different loading modes. They conducted finite element simulations, obtaining significant results, such as the finding that crack growth remains nearly constant for Δ a > 5 mm. Additionally, near the transition angle between Mode I and Mode II, the COD components exhibited greater instability during crack growth. They concluded that using the COD criterion is well justified to predict crack growth under mixed-mode loading conditions.
To validate the inverse method, Biel and Stigh (41) performed a detailed FEA using Abaqus software and DCB samples. Due to the symmetry of the joint, only a quarter of the specimen was modelled. The adhesive was simulated using hyperelastic elements rigidly connected to the adherents. The most important finding of this study was that theoretical and experimental evaluations of the inverse method yielded nearly identical results when the crack began to propagate.
Along these lines, Jahanshahi et al. (42) conducted numerical simulations under various combinations of Mode I and Mode III loading conditions, demonstrating the accuracy of the cohesive model in such cases. Sharma et al. (43) used DCB specimens and modelled the adhesive layer using the CZM approach. The numerically simulated responses were compared with previously published experimental load–displacement responses and were found to be in good agreement. Although all fracture modelling approaches validated experimental trends, the three-dimensional XFEM technique was identified as the most suitable modelling approach to predict crack growth in bonded joints.
In this study, an FEM was developed for the creep test under pure Mode I conditions using MCB specimens composed of steel, polyurethane, and steel. The experimental tests used to develop the FEM are the same as those employed for its validation, ensuring consistency in boundary conditions such as temperature and humidity. The commercial finite element simulation software Abaqus was used. The objective is to obtain the J-integral and to determine the cohesive behaviour law that best fits the experimental results.
It is important to note that adhesive degradation alters the shape of the cohesive law as a whole, not just the maximum stress or strain it can withstand. Additionally, the evolution of the cohesive behaviour law depends on the mixity of the loading mode.
The modelling of these steel–polyurethane–steel adhesive joints was carried out in three distinct phases:
First, a purely mechanical model was developed, in which the adherent, adhesive, and adherent/adhesion interfaces were modelled using cohesive elements.
Second, a water diffusion model in the polymer was proposed based on experimentally determined diffusion coefficients and moisture saturation concentrations.
Finally, both models were integrated so that the behaviour laws of the cohesive elements could be adjusted according to the moisture level at each point of the adherent/adhesive interface.
5.1 Mechanical model of the MCB sample with cohesive elements
The MCB specimen (steel–polyurethane–steel) was modelled using Abaqus for finite element simulation. The developed model has a length of 10 cm and a width of 5 mm. The intermediate polyurethane layer has a length of 9 cm and a thickness of 2.8 mm (Figure 11).
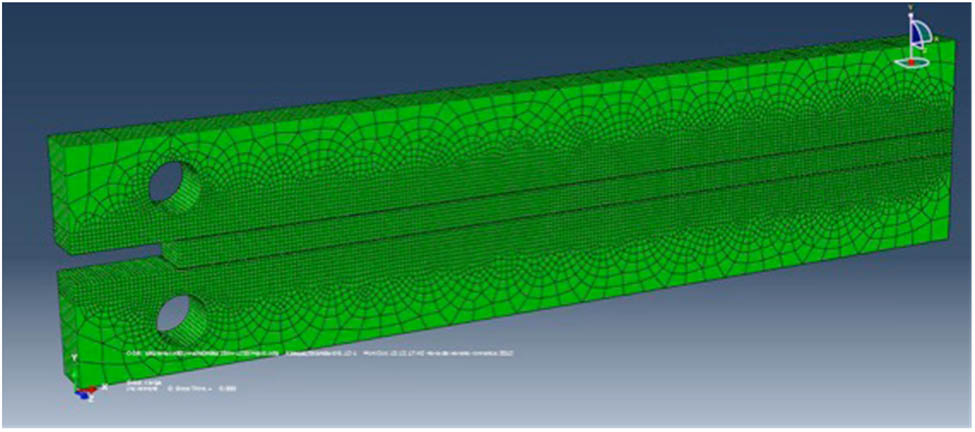
Modelling of an MCB specimen for FEM simulation.
The materials considered for the FEM simulation of the MCB specimen include naval-grade A steel with elastic and linear behaviour for the adherends, bicomponent polyurethane with hyperelastic behaviour for the adhesive, and a bilinear cohesive law for the adhesive–adherent interface, as described in Section 3.2. The elements used to mesh this model are as follows:
Steel (adherent): Hexahedral elements (C3D8R) were defined for a structured mesh. The average element size progressively varies from 0.4 to 2.5 mm.
Polyurethane (adhesive): Hexahedral elements (C3D8R) were used for a structured mesh with an element size of 0.4 mm.
Interface: Defined using hexahedral cohesive elements (COH3D8), mounded using the “offset” technique (create solid layers). Each element has a size of 0.4 mm, and the thickness of the interface layer is 0.1 mm.
Regarding the boundary conditions of the adherends, the model is fixed at the lower adherend in the interior of the lower hole and the lower right end. For the upper adherent, a vertical displacement of 3.5 mm was applied to the upper-half of the inner loading hole of the upper adherent.
When simulating the test using FEM with the described model, it has been observed that the deformation is concentrated in the adhesive, as it is a hyperelastic material capable of deforming under relatively low stresses and with very high strains. It has also been noted that the Poisson ratio of these hyperelastic materials (approximately 0.5) causes significant lateral contraction during load application, while maintaining the material’s volume.
Figure 12 shows various phases of the simulation of the Mode I test for the MCB specimen, where the adhesive deformation is visible. The deformations in the adherend are well below the elastic limit of the material, and there is practically no deformation in the adherend itself. Therefore, the adherent behaves roughly like a rigid solid. However, high traction values are reached in the cohesive elements. The loading process continues until failure conditions are reached in the adhesive or until the maximum stresses are reached in the cohesive elements (whichever occurs first).
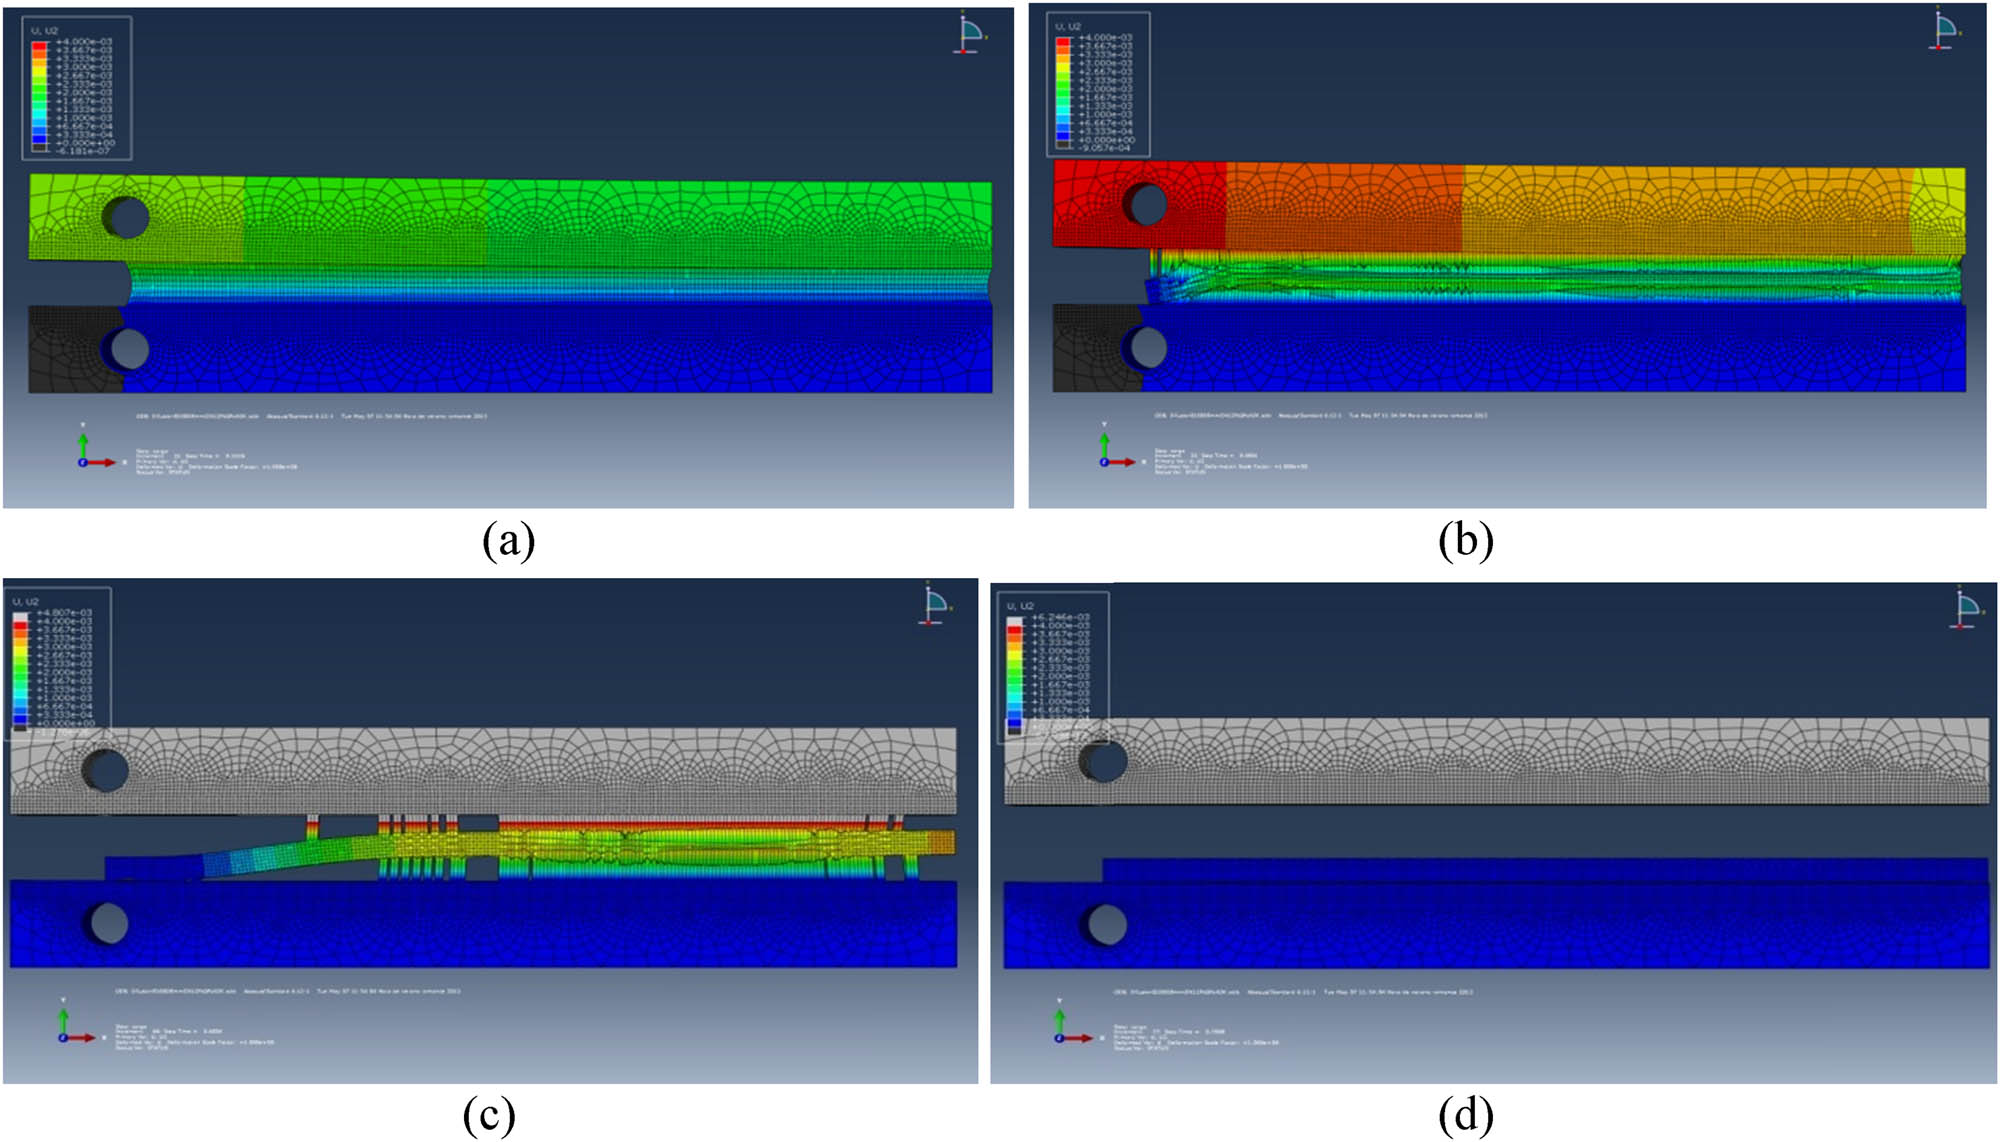
FEM simulation of the Mode I test and phases of adhesive deformation in the MCB specimen, images (a) to (c), until adhesive failure, image (d).
From the results of the model, it can be concluded that the failure conditions of the cohesive elements located at the periphery of the polyurethane adhesive are first reached. This gradually generates a crack that propagates until the adhesive is fully detached. Figure 13 shows the state of the cohesive elements, indicating which elements have failed (blue) and which remain active (red) to illustrate the progression of the delaminated zone.
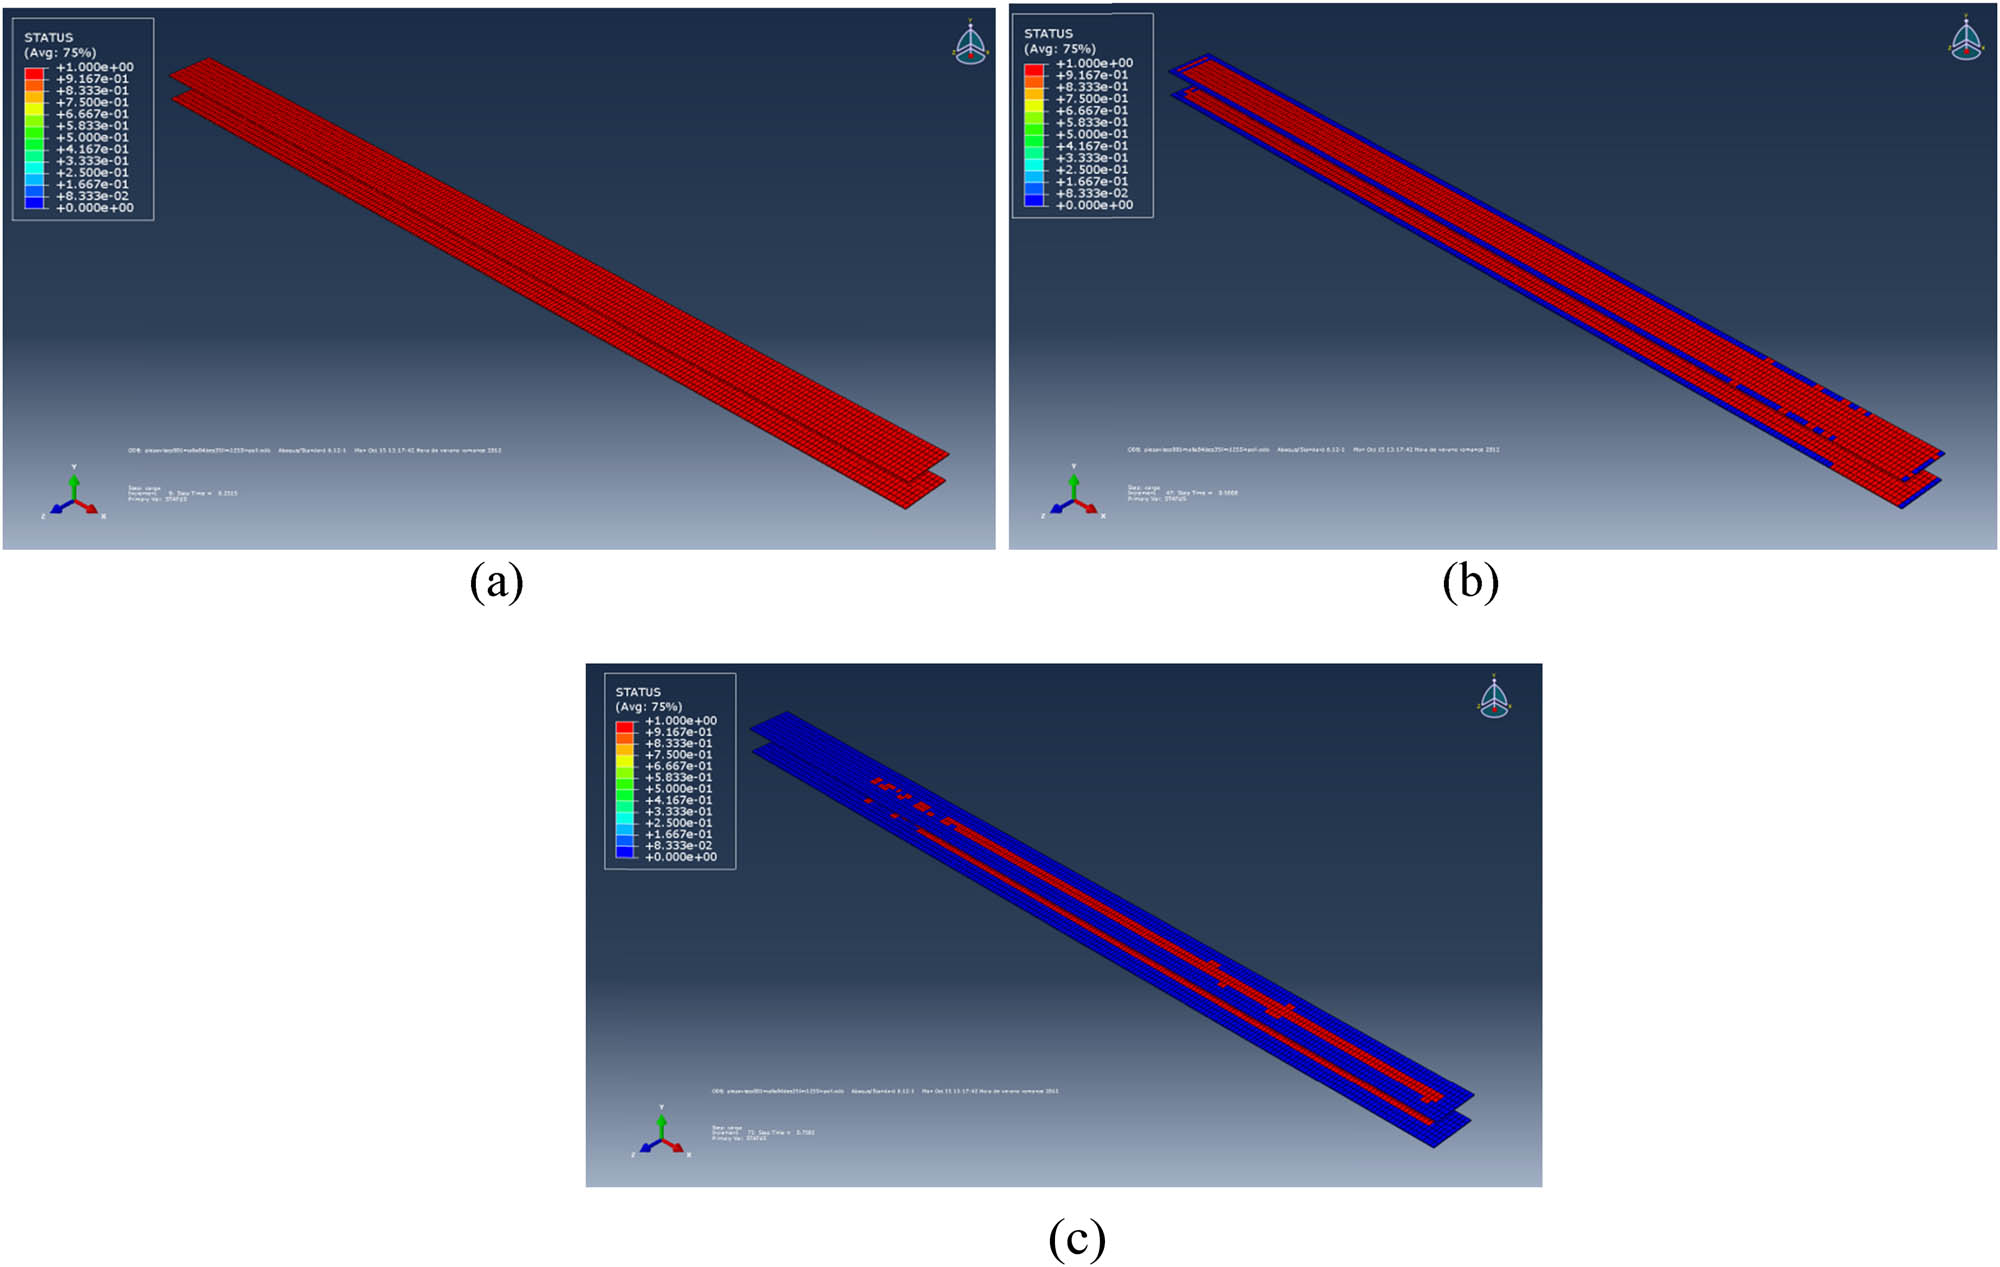
Evolution of the displacement of the delaminated zone: 25% (a), 50% (b), and 75% (c).
Figure 14 shows the actual sequence of crack formation and propagation in the adhesive joint obtained from the experimental test. A comparison can be made between the results of the FEM simulation model and the real images obtained in the experimental test. In particular, note that both analyses indicate that the initial failure does not occur at the end of the bonded area, but slightly behind it.
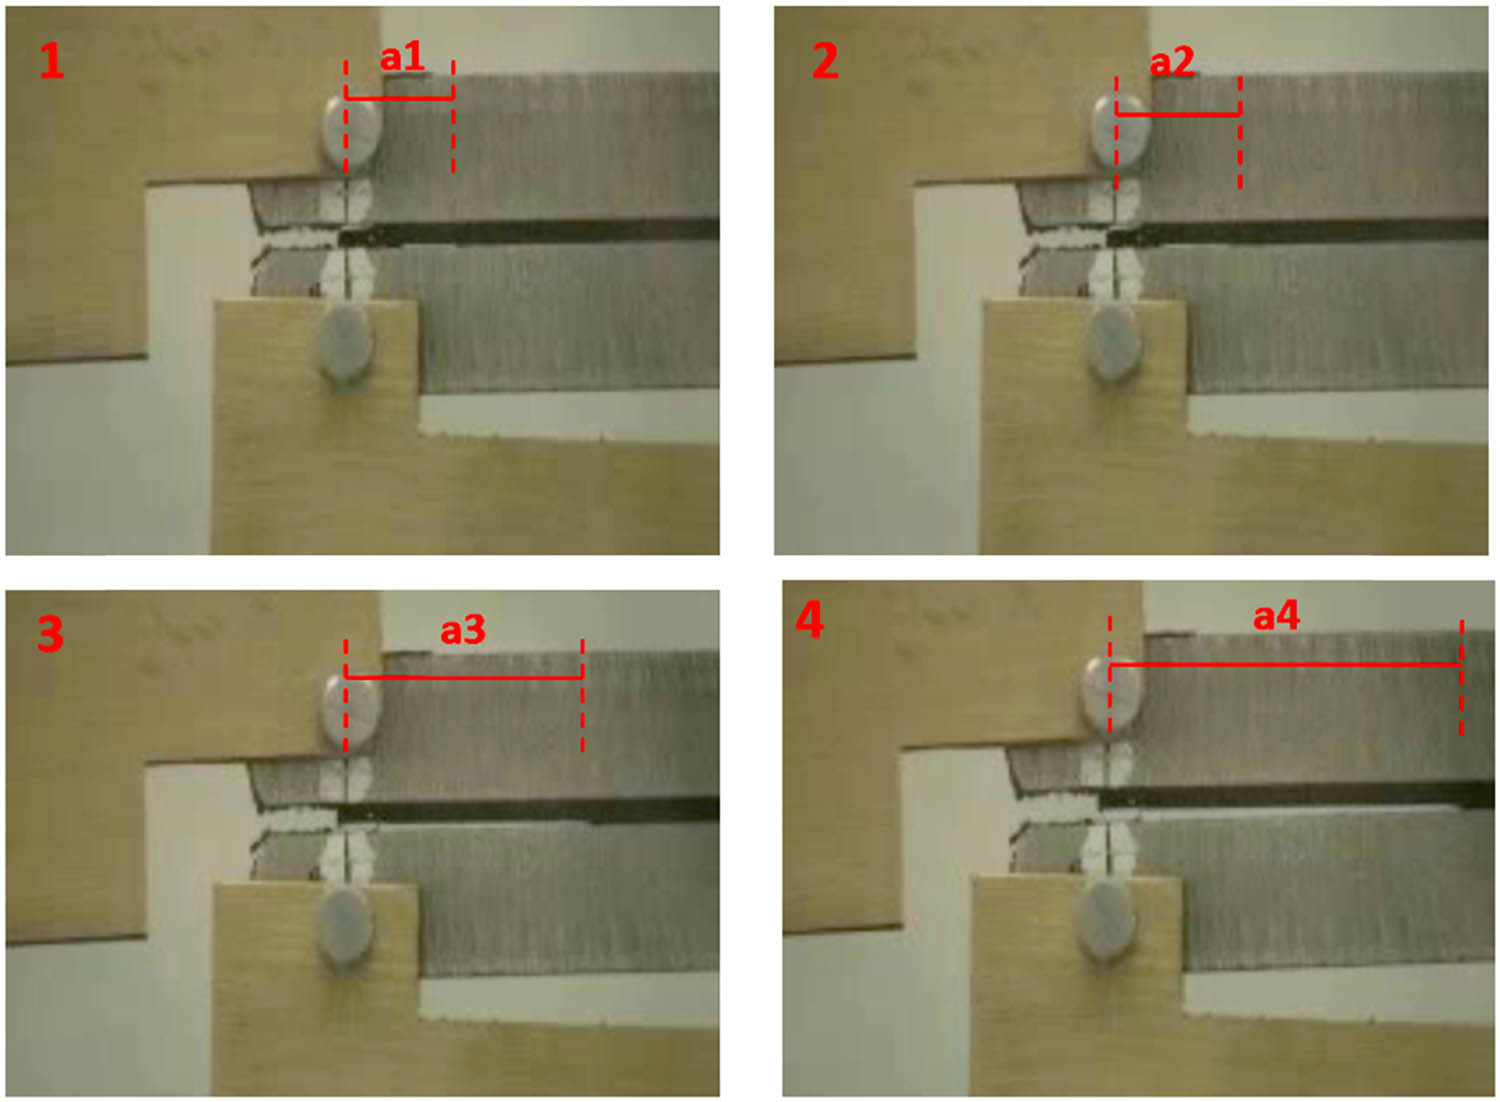
Actual evolution of the delaminated zone in the adhesive joint during the test.
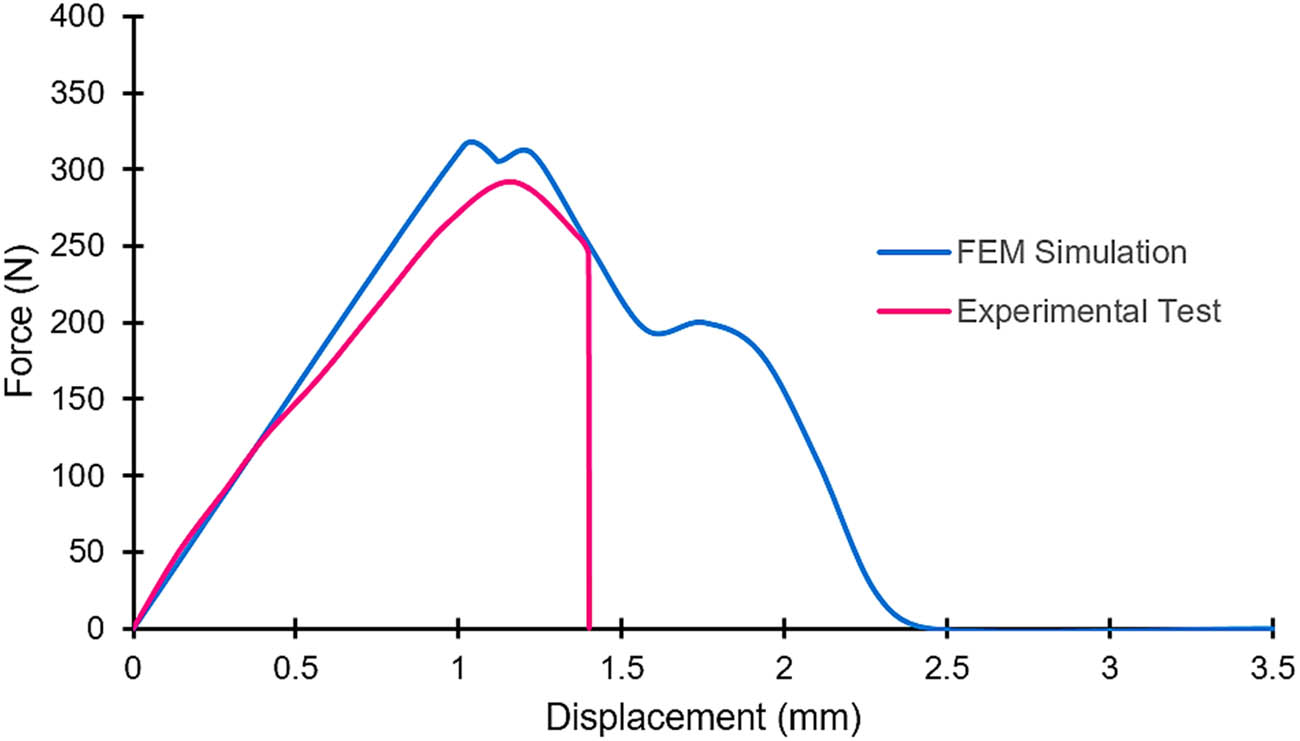
Finally, Figure 15 shows a graph representing the force as a function of displacement obtained from the FEM simulation of the test on the specimen. The graph displays an initial linear elastic behaviour until a maximum is reached, at which point the cohesive elements begin to fail, leading to a decrease in the stiffness of the adhesive joint.
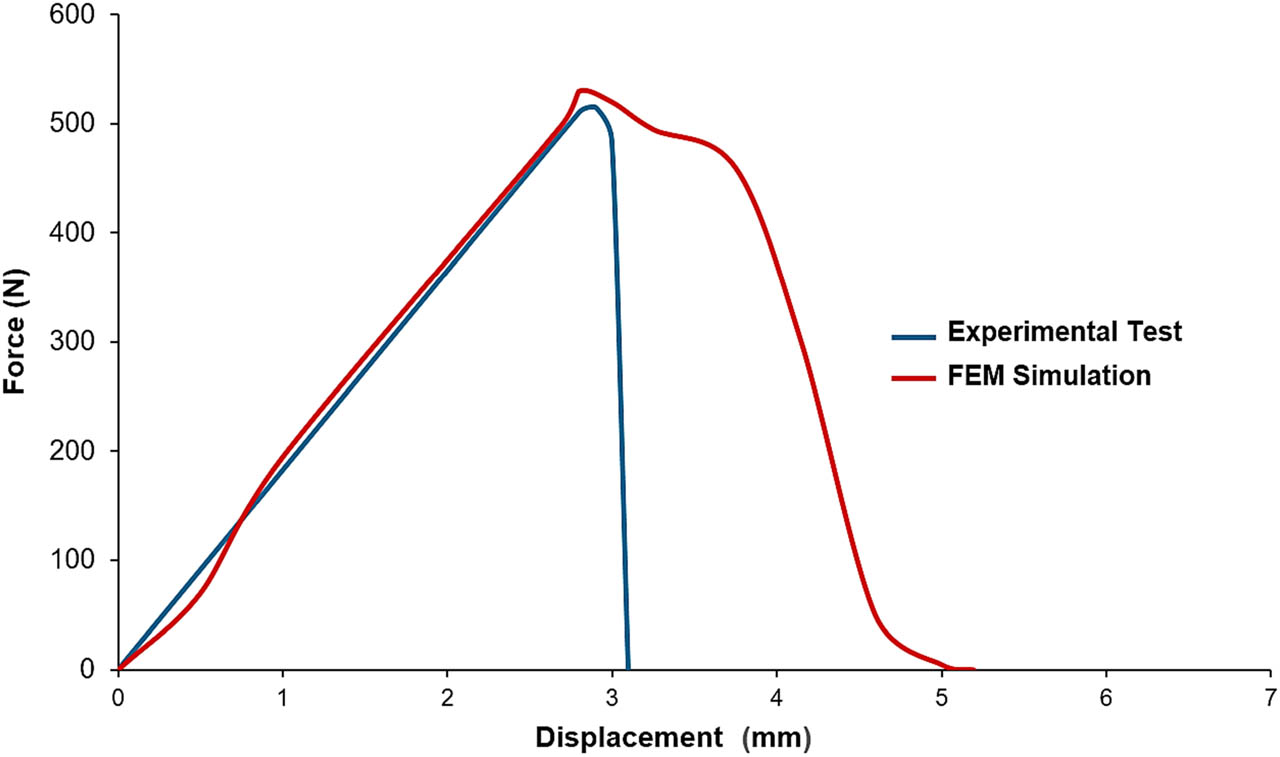
Force–displacement curves obtained by FEM simulation and experimental test (without immersion in seawater).
The parameters of the cohesive laws have been adjusted so that the force–displacement curve from the FEM matches the graph obtained experimentally. The law of behaviour of the cohesive elements used is shown in Figure 16. It shows that the cohesive elements reach their maximum stress at a relative deformation of 1; from this deformation onwards, the stiffness of the cohesive elements decreases until the point of relative deformation 3, at which the cohesive elements fail completely and become inactive.
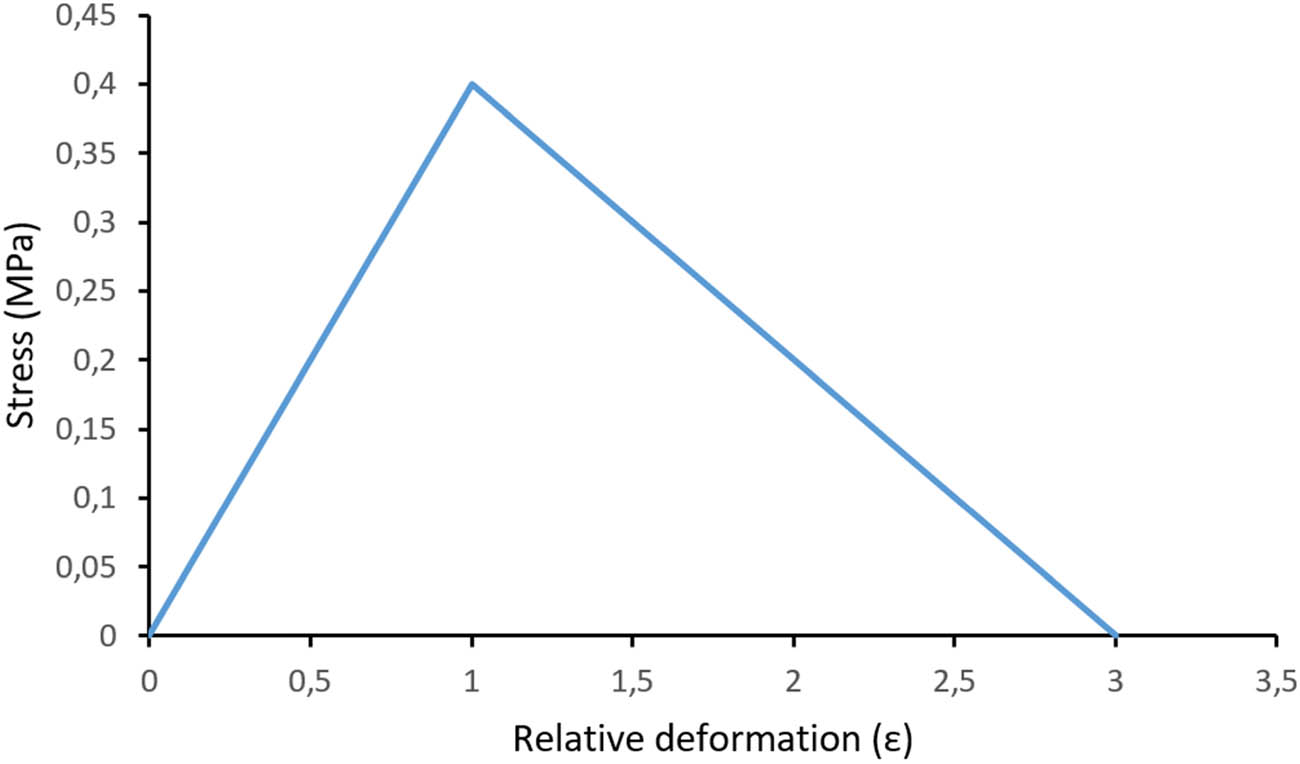
Behaviour law of the cohesive element.
5.2 FEM of the water diffusive process in polyurethane adhesive
An FEM has been created to simulate the water absorption in the adhesive. For this, the diffusion coefficients and the maximum water saturation concentrations in the polymer, determined experimentally, were used. Simulations were performed at three different times, and water concentration profiles in the joint were obtained for each of these times.
It is important to note that water enters the adhesive through the four lateral faces, not through the top and bottom faces, where the adherents are bonded to the adhesive. Figure 17 shows the results of the water diffusion simulation in the adhesive after 30, 90, and 180 days of immersion in seawater. The adherents have been removed in Figure 17 to better show the evolution of water uptake at the adherent/adhesive interface.
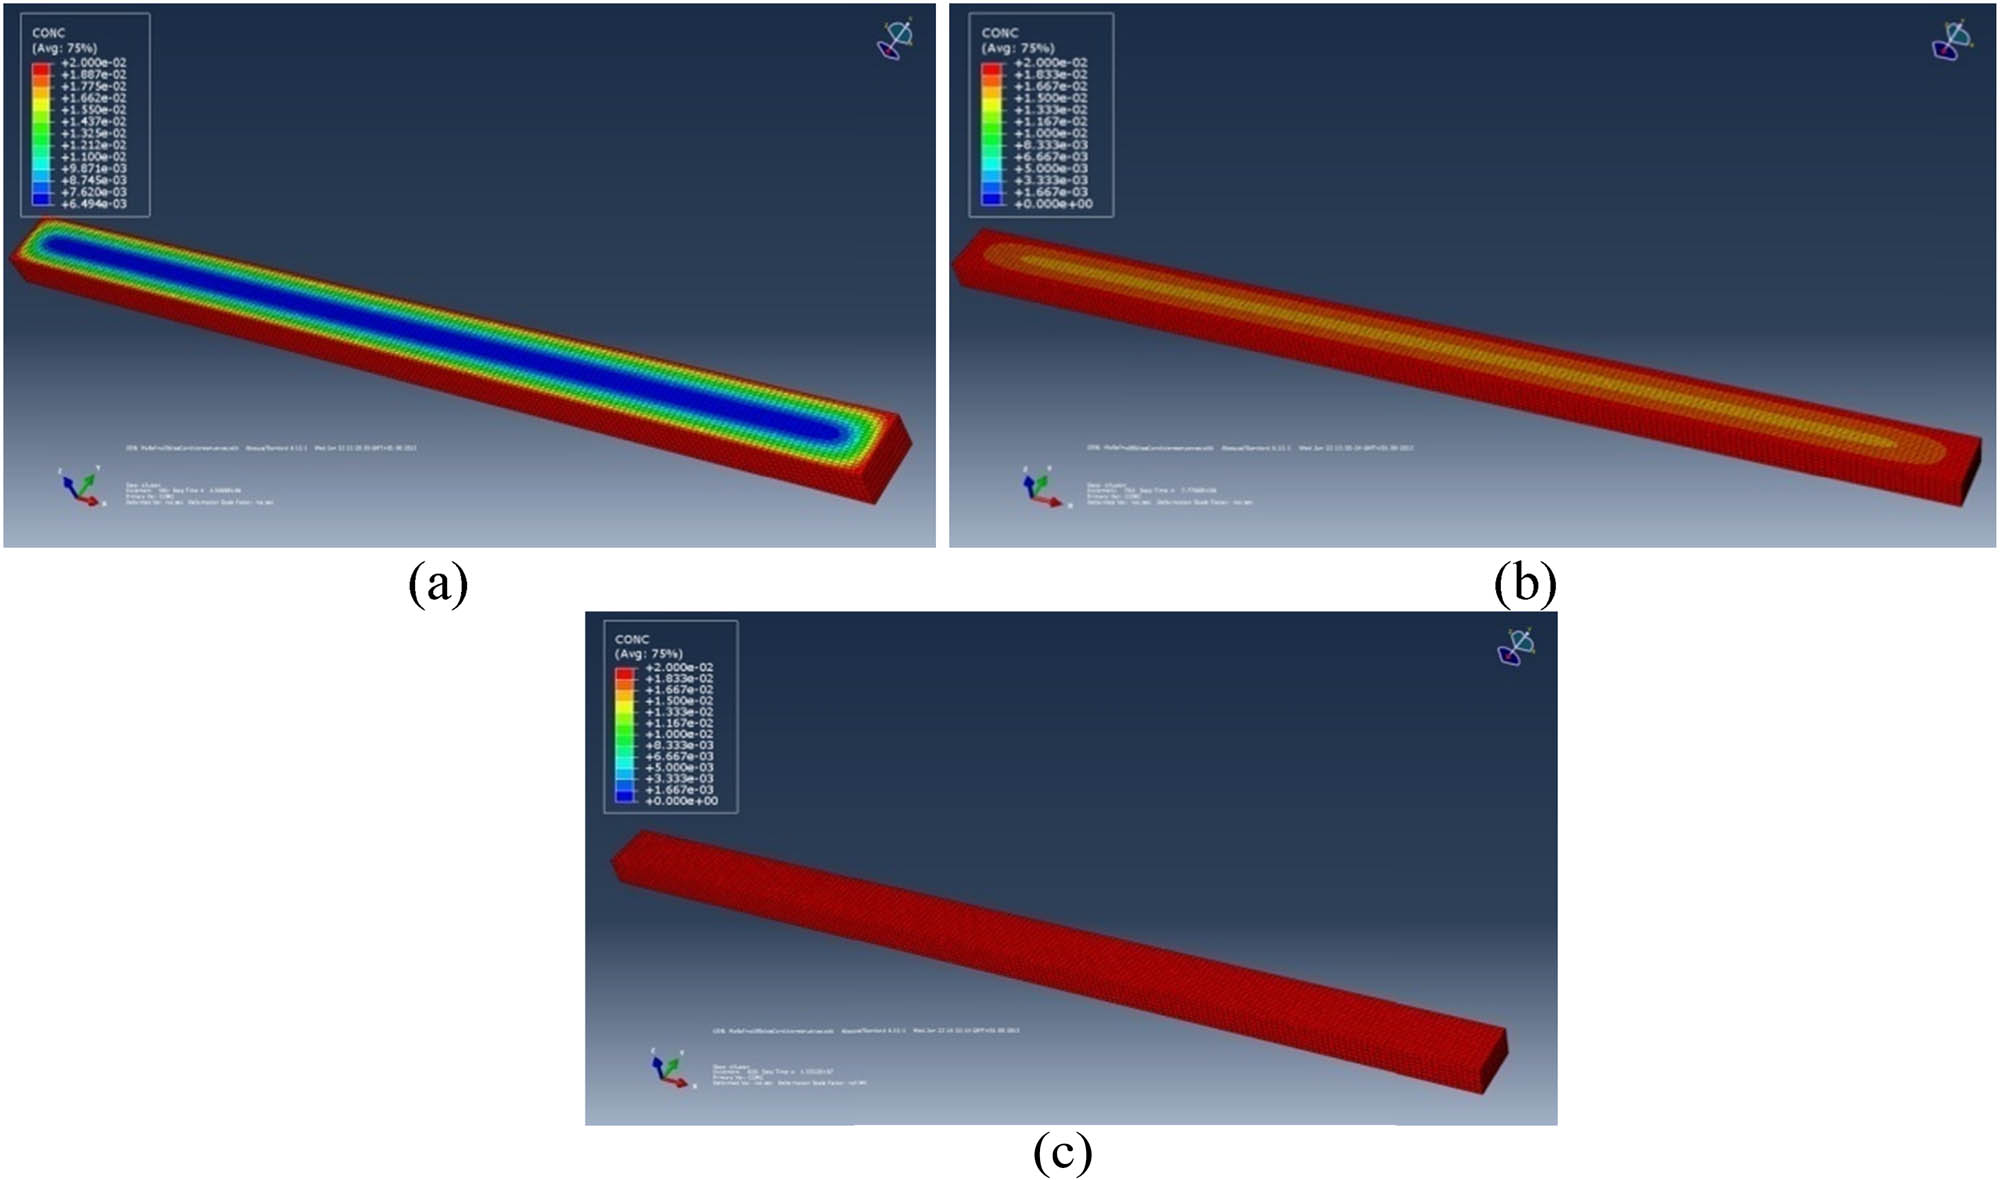
FEM simulation of water diffusion in the adhesive after 30 (a), 90 (b), and 180 days (c).
Figure 18 shows the curves of the variation in the water content of the adhesive (concentration profile) as a function of its distance from the centre of the adhesive layer and the number of days of immersion. The concentration profile curves are symmetric with respect to the centre of the specimen because the water enters through the lateral surfaces of the adhesive. When comparing the profiles for the three immersion times, it is observed that gradually the entire polymer becomes saturated with water until it reaches the maximum value for times greater than 180 days. The red line marks the critical concentration (complete saturation) experimentally calculated for the polyurethane adhesive (0.61%), and the shaded orange area indicates the damaged zone for the 30-day immersion case. In this case, it is noticeable that the critical concentration has not yet reached the centre of the adhesive bond, but water has penetrated through the edges of the adhesive, leading to the degradation of the polymer.
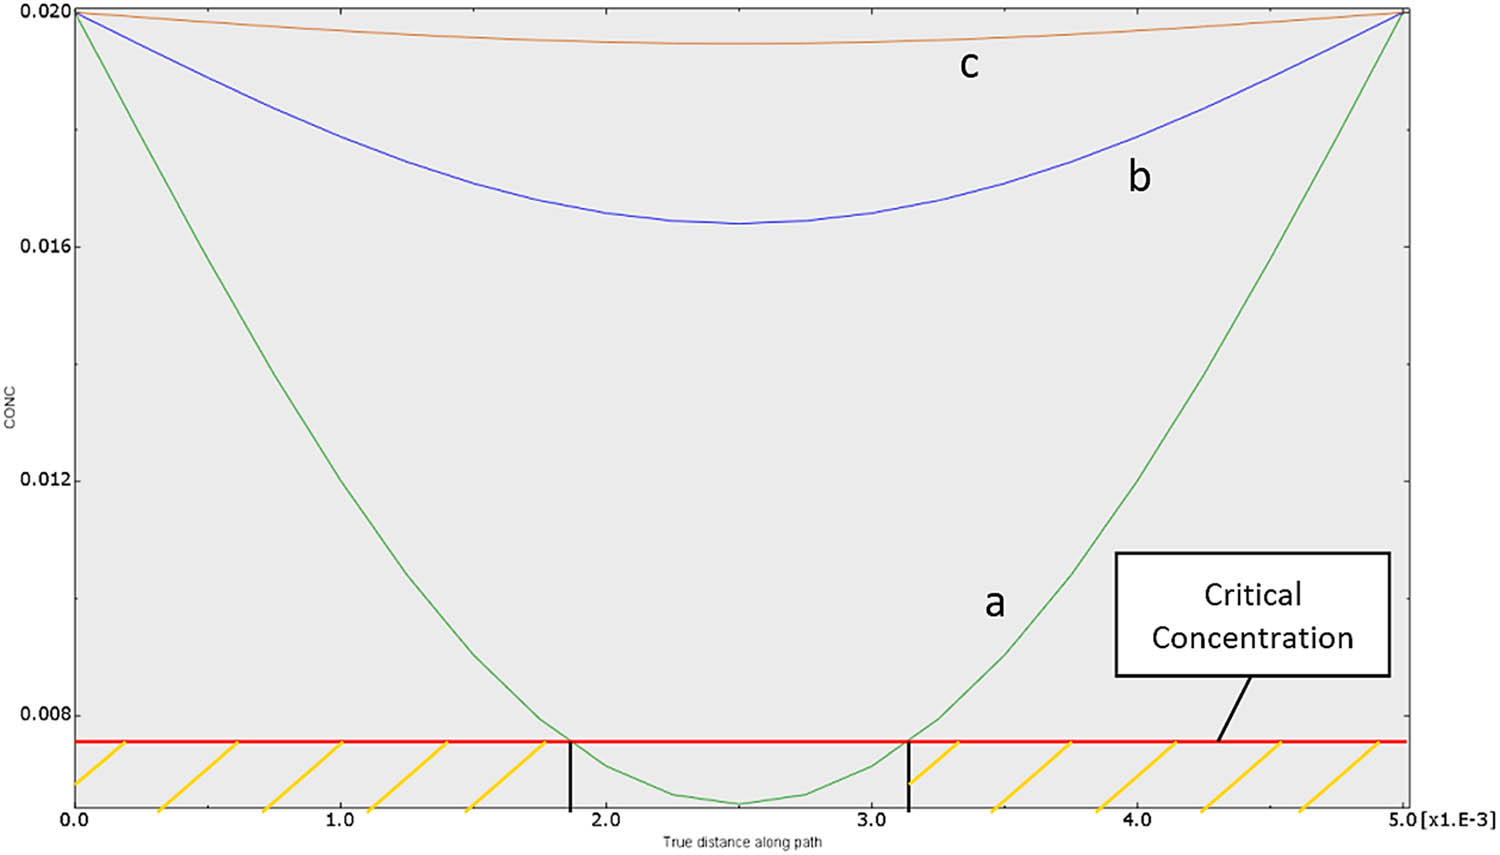
Concentration profiles of moisture in the adhesive after immersion in seawater for 30 days (a), 90 days (b), and 180 days (c).
5.3 FEM simulation of the Mode I test with polyurethane degradation
In this phase of the simulation of adhesive joint behaviour, the two previous models are integrated in such a way that the behaviour laws of the cohesive element can be modified according to the moisture level at each point of the adherent/adhesive interface. In this regard, the characteristics related to the dimensions, boundary conditions, and meshing are identical to those described for the mechanical model.
First, the amount of water that enters the adhesive has been determined. The presence of moisture in the polymer induces a change in the properties in different areas of the adhesive, meaning that distinct cohesive laws are applied to each zone. Next, the mechanical test is modelled with the adhesive degraded by the moisture effect (the effect of the stress state on the diffusion of water is not considered).
A specific case of water diffusion in the adhesive has been selected, assuming that 100% of the water penetrates the outer areas of the polyurethane while the central zone remains intact. Figure 19 shows the model used: the red band indicates the exterior of the adhesive joint, where 100% water penetration is assumed, the yellow–green bands represent areas with 75% water penetration, and the blue zone, corresponding to the centre of the adhesive, remains intact.
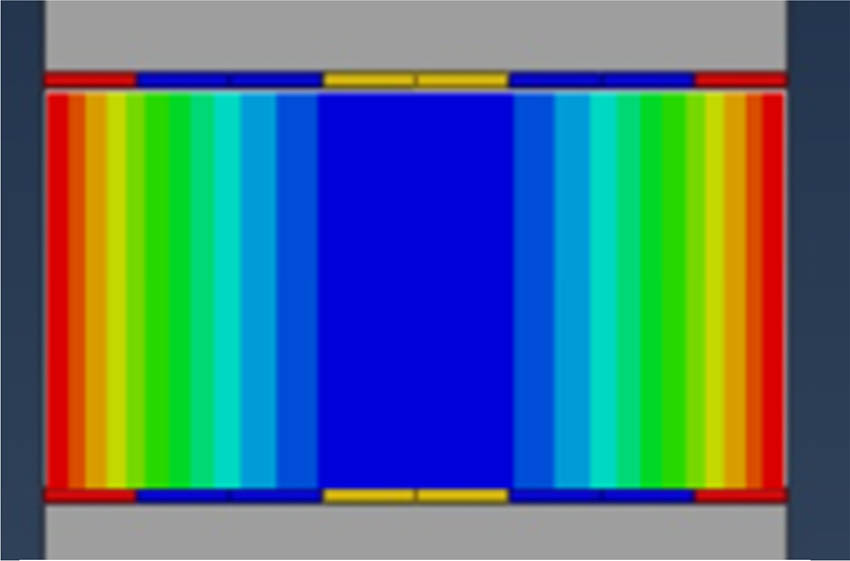
Simulation of water diffusion in the adhesive using strips of different colors.
Figure 20 shows the results of the FEM simulation of the Mode I test on the MCB sample with the adhesive degraded by the effect of moisture in different stages of the test (from the initial phase of adhesive deformation to complete detachment of the adhesive and adherent). The FEM combines the mechanical model and the moisture diffusion model in the adhesive described in the previous sections.
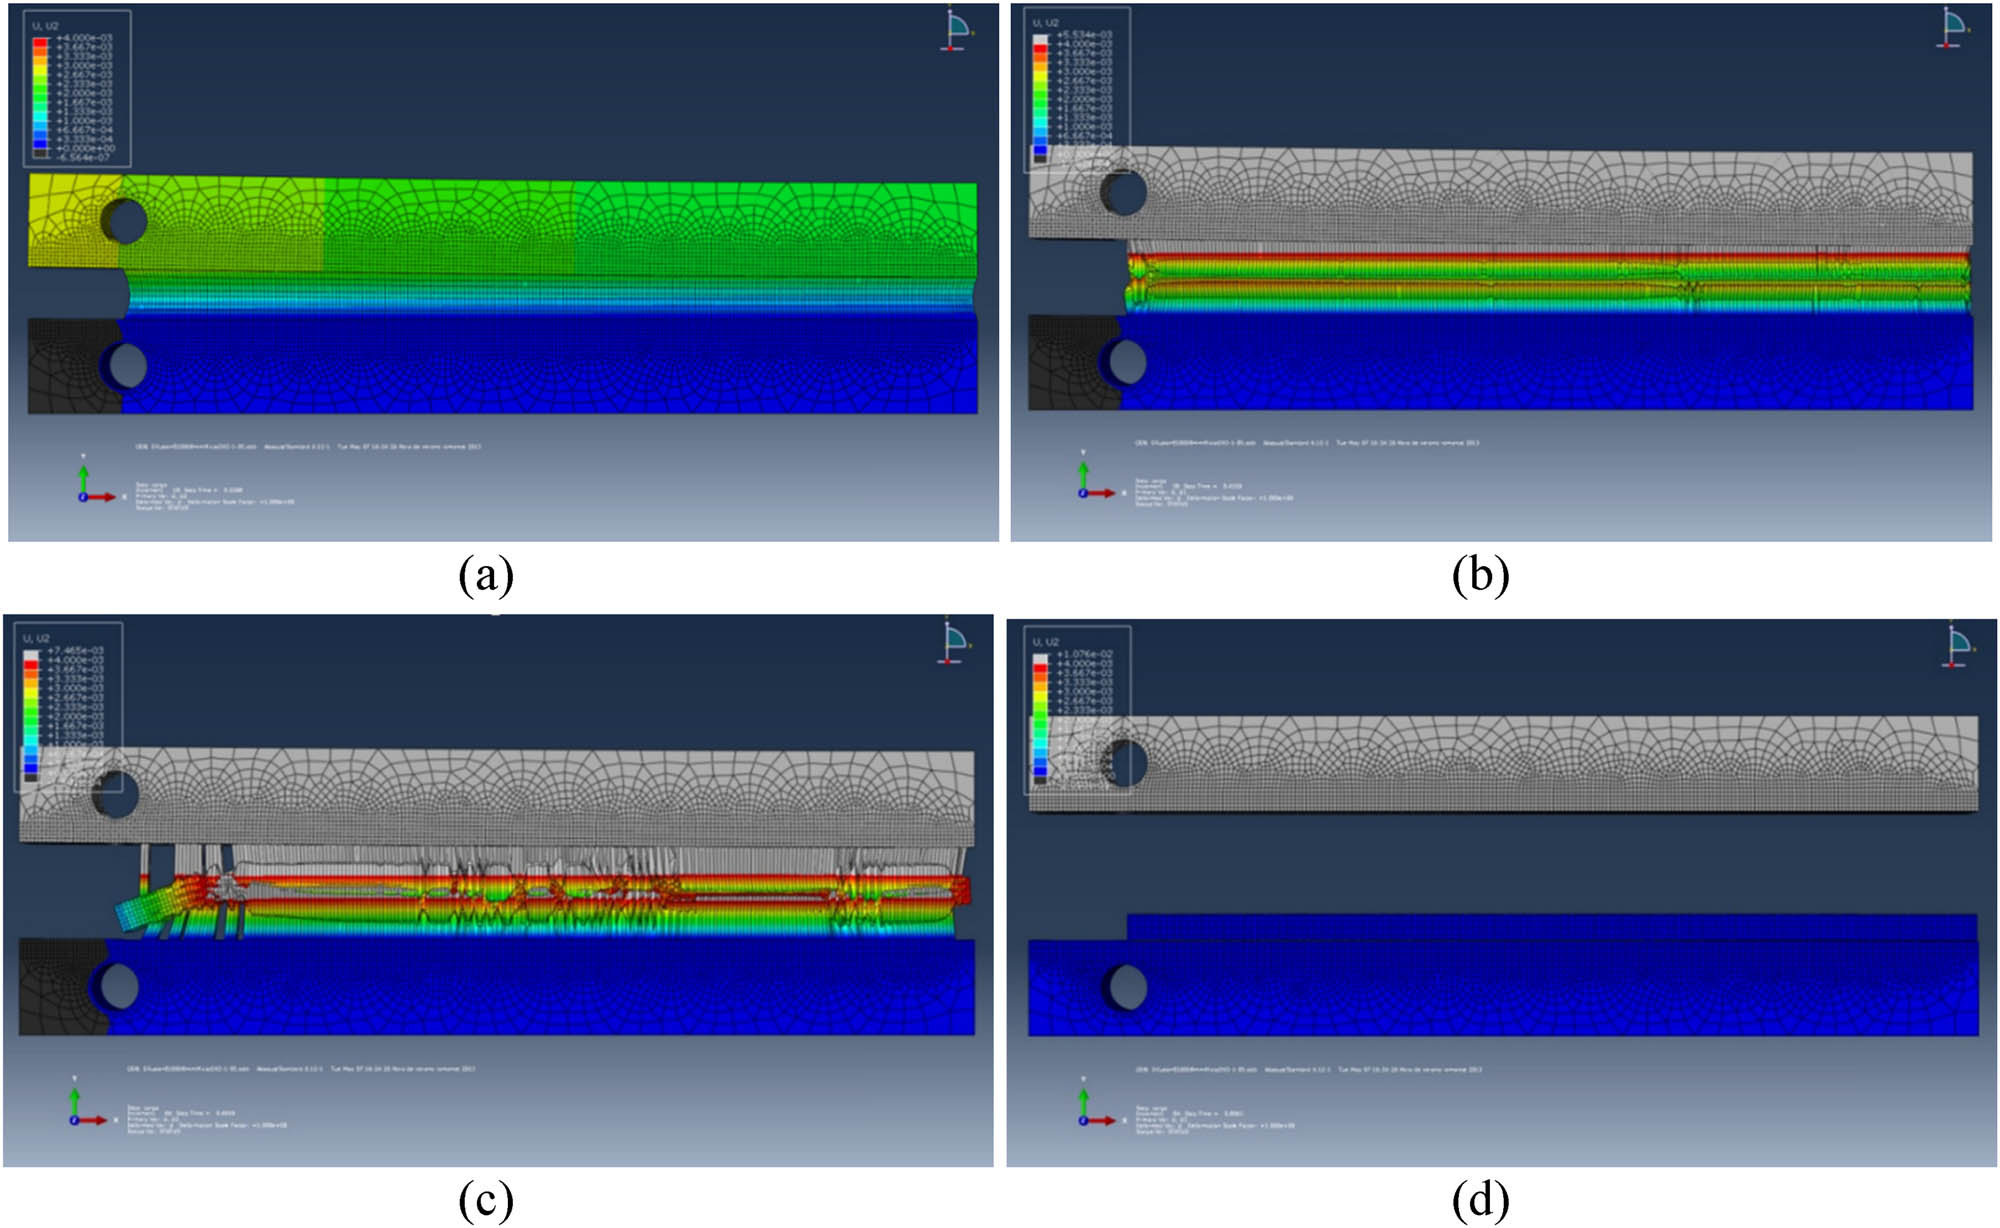
FEM simulation of the Mode I test on the MCB specimen with the adhesive degraded at different stages: initial elastic deformation of the adhesive (a), initiation and propagation of adhesive failure (b and c), and complete detachment of adhesive and adherent (d).
To better observe the behaviour of the adhesive during the test, Figure 21 shows only the adhesive (the adherents have been removed from the visualization) with different states of the cohesive elements during the Mode I test. Specifically, it shows the moments when the displacement is 0, 3.2, 4.4, and 6.72 mm. The evolution of the detached area can be seen as the cohesive elements fail (in blue), while other elements remain active (in red).
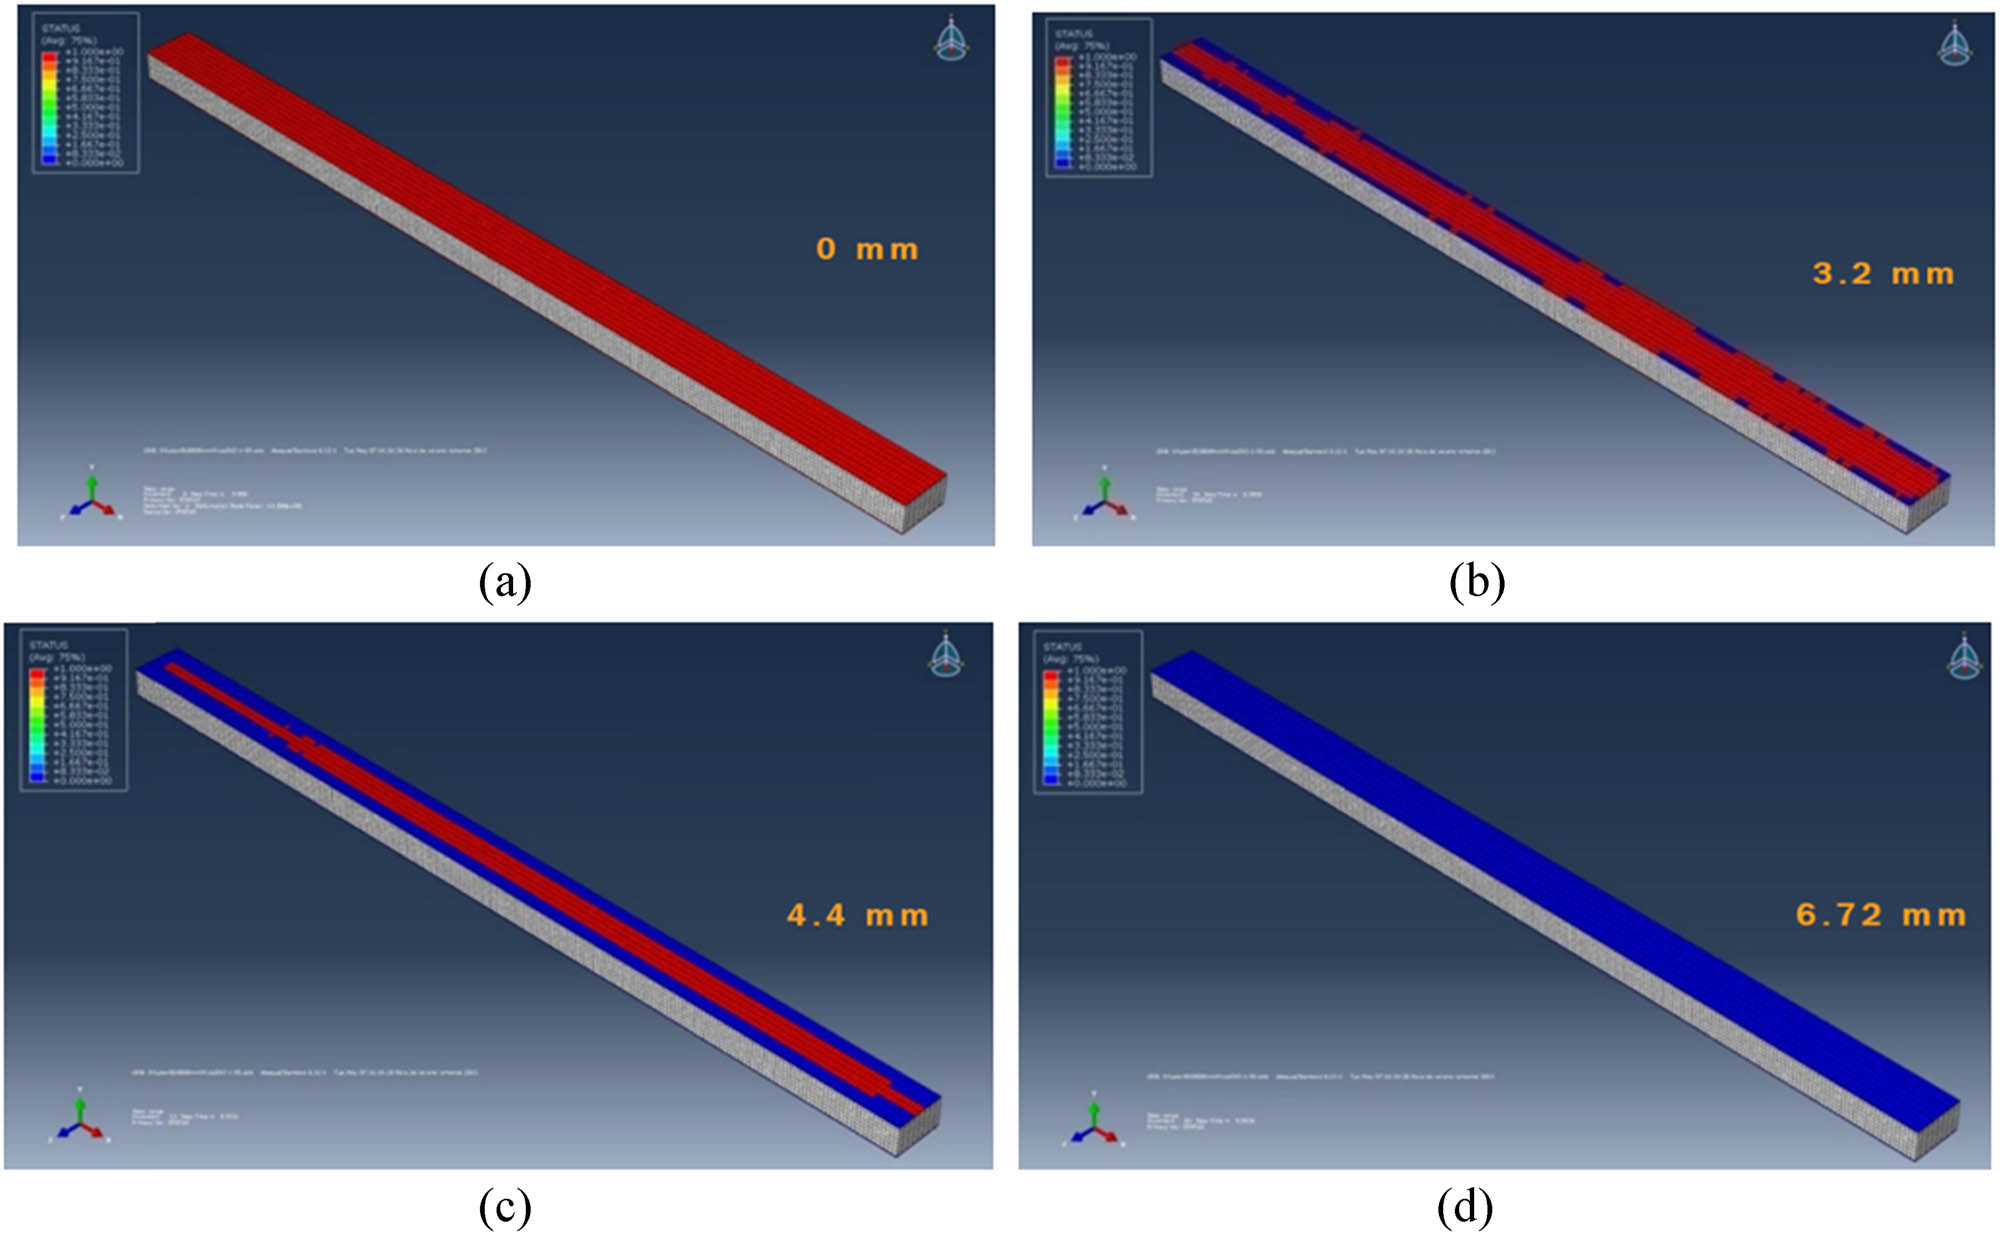
State of the cohesive elements during the Mode I test at the moments when the displacement is 0 mm (a), 3.2 mm (b), 4.4 mm (c), and 6.72 mm (d).
Therefore, in order to properly interpret the tests and understand the progressive failure process of the cohesive elements and how the detached area between the adhesive and adherent propagates, it is necessary to develop an FEM that takes into account the changes in the cohesive behaviour laws in each region of the adhesive–adherent interface due to its moisture level.
Figure 22 shows the force–displacement curve for the Mode I test obtained in the FEM simulation by combining the mechanical model and the water diffusion in the adhesive. It can be observed that once failure occurs, the central area of the adhesive remains intact (without the presence of moisture), and the specimen continues to maintain some capacity to support the load until it finally fails at the centre of the specimen.
Force–displacement curves for the Mode I obtained by experimental test and FEM (by combining the mechanical model and water diffusion in the adhesive).
6 Conclusions
The objective of the present work was to perform a dual analysis, experimental and FEM simulation, of steel–polyurethane–steel adhesive joints to evaluate their mechanical fracture behaviour in Mode I (through creep testing) under accelerated ageing conditions of the polymer due to the combined action of moisture (immersed in seawater) and high temperature (50°C). The experimental results obtained from the tests allowed the development of an FEM simulation of the polyurethane adhesive joint using the Abaqus programme.
The main conclusions from the experimental analysis were as follows:
Moisture concentration profiles in the polyurethane adhesive after immersion in seawater for different periods (between 1 and 180 days) were determined. Specifically, it was found that the “critical concentration” was 0.61% (reached on the ninth day), and the diffusion coefficient of seawater in polyurethane was 5.1 × 10⁻¹³ m2·s−1. Furthermore, it was verified that 139 days are needed for moisture to reach the centre of the adhesive.
The results of the fracture test of the adhesive joint in Mode I allowed, on the one hand, the measurement of shear and peeling displacements of the adhesive layer (v and w) and verified that the deformation occurring in the vertical axis was greater than that in the horizontal axis (due to the peeling test). On the other hand, the fracture energy variation curve with respect to elongation and the cohesive behaviour law of the polyurethane adhesive (in Mode I at 50°C after 7 days of immersion in seawater) was obtained, showing that the maximum stress was 0.32 MPa, corresponding to the critical strain of 0.02 mm.
The developed FEM simulation allowed, on the one hand, validation of the experimental measurements taken and, on the other hand, simulation of the behaviour of the polyurethane–steel adhesive interface under adverse environmental conditions when subjected to constant load in Mode I, making it possible to predict the failure moment and its shape. Specifically, the main conclusions of the FEM were as follows.
Development of a mechanical model where the adherent, adhesive, and adherent/adhesive interfaces are modelled using cohesive elements. It was found that there is a high similarity between the FEM simulation of crack formation and propagation in the adhesive joint and the observations made in the experimental tests.
Development of a water diffusion model in the polymer on the basis of the experimentally determined diffusion coefficients and moisture saturation concentrations. In particular, the moisture concentration profiles in the adhesive were simulated, showing that the polymer becomes saturated with moisture for immersion times longer than 180 days.
A combination of mechanical and diffusion models into an FEM simulation model that allows modifying the cohesive element behaviour laws based on the moisture level at each point of the adherent/adhesive interface. This model was validated by the experimental results obtained from the tests.
As a final conclusion, this article has demonstrated that the developed FEM has the ability to predict the mechanical behaviour of adhesive joints subjected to environmental degradation, specifically due to moisture diffusion and seawater immersion. The agreement between the simulation results and the experimental force–displacement curves, both in dry and aged conditions, validates the model’s predictive capability. This makes it a useful tool for assessing the long-term performance of adhesive joints in marine environments.
Acknowledgments
The authors acknowledge the collaboration of the technical staff at the laboratory: Mr. José Illescas, Ms. Ana Soria, and Ms. Ana García.
-
Funding information: The authors thank the Universidad Politécnica de Madrid for funding this work (project REM195605JMAR).
-
Author contributions: Cristina Alía: conceptualization, formal analysis, investigation, data curation, and writing – original draft. José Manuel Arenas: conceptualization, investigation, methodology, supervision, writing original draft, and writing – review & editing. Juan Carlos Suárez-Bermejo: conceptualization, formal analysis, methodology, resources, supervision, and writing review & editing. Álvaro Rodríguez: data curation, software, validation, and visualization.
-
Conflict of interest: The authors declare no conflict of interest.
References
(1) Herreros MA, Suárez JC, Pinilla P, Miguel S, López F, Diez de Ulzurrun F. MaLECoN: A new laminated fiber-metal hybrid for shipbuilding. Proceedings of the 47th Naval engineering and maritime industry congress, Palma de Mallorca, Spain; 2008.Search in Google Scholar
(2) Alía C, Biezma MV, Pinilla P, Arenas JM, Suárez JC. Degradation in seawater of structural adhesives for hybrid fibre-metal laminated materials. Adv Mater Sci Eng. 2013;1:1–10.10.1155/2013/869075Search in Google Scholar
(3) Davies P. Marine industry. In: Da Silva LFM, Öchsner A, Adams RD, editors. Handbook of adhesion technology. Berlin: Springer; 2011. p. 1237–62.10.1007/978-3-642-01169-6_48Search in Google Scholar
(4) Ashcroft I, Comyn J. Effect of water and mechanical stress on durability. In: Da Silva LFM, Öchsner A, Adams RD, editors. Handbook of adhesion technology. Berlin: Springer; 2011. p. 787–822.10.1007/978-3-642-01169-6_31Search in Google Scholar
(5) Korenberg CF, Kinloch AJ, Watts JF. Crack growth of structural adhesive joints in humid environments. J Adhes. 2004;80:169–201.10.1080/00218460490279233Search in Google Scholar
(6) Galvez P, Lopez de Armentia S, Abenojar J, Martinez MA. Effect of moisture and temperature on thermal and mechanical properties of structural polyurethane adhesive joints. Compos Struct. 2020;247(112443):1–13.10.1016/j.compstruct.2020.112443Search in Google Scholar
(7) Dillard DA, Pocius AV. The mechanics of adhesion. 1st edn Amsterdam: Elsevier Science B.V; 2002.Search in Google Scholar
(8) Böer P, Holliday L, Kang TH-K. Independent environmental effects on durability of fiber-reinforced polymer wraps in civil applications: A review. Constr Build Mater. 2013;48:360–70.10.1016/j.conbuildmat.2013.06.077Search in Google Scholar
(9) Nguyen TC, Bai Y, Zhao XL, Al-Mahaidi R. Curing effects on steel/CFRP double strap joints under combined mechanical load, temperature and humidity. Constr Build Mater. 2013;40:899–907.10.1016/j.conbuildmat.2012.11.035Search in Google Scholar
(10) Hartanto D, Hamed E, Agarwal A, Foster SJ. Behaviour of steel-CFRP lap joints under hygrothermal cycles and sustained loadings. Compos Struct. 2018;203:740–9.10.1016/j.compstruct.2018.07.032Search in Google Scholar
(11) Davies P, Evrard G. Accelerated ageing of polyurethanes for marine applications. Polym Degrad Stab. 2007;92(8):1455–64.10.1016/j.polymdegradstab.2007.05.016Search in Google Scholar
(12) Momber AW, Fröck L, Marquardt T. Effects of accelerated ageing on the mechanical properties of adhesive joints between stainless steel and polymeric top coat materials for marine applications. Int J Adhes Adhes. 2020;103(102699):1–14.10.1016/j.ijadhadh.2020.102699Search in Google Scholar
(13) Alia C, Arenas JM, Suárez JC, Pinilla P. Mechanical behavior of polyurethane adhesive joints used in laminated materials for marine structures. Ocean Eng. 2016;113:64–74.10.1016/j.oceaneng.2015.12.044Search in Google Scholar
(14) Alia C, Arenas JM, Suárez JC, Pinilla P. Mechanical behaviour of vinylester adhesive joints used in laminated material for steel structures. Mar struct. 2020;69(102687):1–15.10.1016/j.marstruc.2019.102687Search in Google Scholar
(15) Costa M, Viana G, Créac’hcadec G, da Silva LFM, Campilho RDSG. A cohesive zone element for mode I modelling of adhesives degraded by humidity and fatigue. Int J Fatigue. 2018;112:173–82.10.1016/j.ijfatigue.2018.03.014Search in Google Scholar
(16) Han X, Akhmet G, Hu P, Hou W, Baubekov Y, Akhmetov M. Numerical prediction on the mechanical degradation of adhesively bonded corrugated sandwich beam after hygrothermal ageing. Compos Struct. 2020;241(112131):1–13.10.1016/j.compstruct.2020.112131Search in Google Scholar
(17) Viana G, Costa M, Banea MD, da Silva LFM. Moisture and temperature degradation of double cantilever beam adhesive joints. J Adhes Sci Technol. 2017;31(16):1824–38.10.1080/01694243.2017.1284640Search in Google Scholar
(18) Bordes M, Davies P, Cognard JY, Sohier L, Sauvant-Moynot V, Galy J. Prediction of long term strength of adhesively bonded steel/epoxy joints in sea water. Int J Adhes Adhes. 2009;29(6):595–608.10.1016/j.ijadhadh.2009.02.013Search in Google Scholar
(19) Suárez JC, Pinilla P, López F, Herreros MA, Biezma MV. Mixed mode double cantilever beams test specimen for characterization of structural adhesive joints. An de Mecánica de Fractura. 2010;27:685–91.Search in Google Scholar
(20) Suárez JC, Alía C, Pinilla P, Biezma MV. Degradación a largo plazo de uniones adhesivas estructurales: Ensayos en modo mixto de probetas DCB. An de Mecánica de Fractura. 2011;2:663–8.Search in Google Scholar
(21) Högberg JL, Sørensen BF, Stigh U. Constitutive behaviour of mixed mode loaded adhesive layer. Int J Solids Struct. 2007;44:8335–54.10.1016/j.ijsolstr.2007.06.014Search in Google Scholar
(22) Sørensen RF, Kirkegaard P. Determination of mixed mode cohesive laws. Eng Fract Mech. 2006;73:2642–61.10.1016/j.engfracmech.2006.04.006Search in Google Scholar
(23) Högberg JL. Mixed mode cohesive law. Int J Fract. 2006;141:549–59.10.1007/s10704-006-9014-9Search in Google Scholar
(24) Banea MD, da Silva LFM, Casbas R, De Barros S. Effect of temperature and moisture on the tensile properties of a TEPs modified adhesive. Materiale Plastice. 2018;55(4):610–4.10.37358/MP.18.4.5057Search in Google Scholar
(25) da Silva LFM, das Neves PJC, Adams RD, Wang A, Spelt JK. Analytical models of adhesively bonded joints Part II: Comparative study. Int J Adhes Adhes. 2009;29(4):331–41.10.1016/j.ijadhadh.2008.06.007Search in Google Scholar
(26) Borg R, Nilsson L, Simonsson K. Simulation of delamination in fiber composites with a discrete cohesive failure model. Compos Sci Technol. 2001;61(5):667–77.10.1016/S0266-3538(00)00245-1Search in Google Scholar
(27) Baldan A. Adhesively-bonded joints and repairs in metallic alloys, polymers and composite materials: Adhesives, adhesion theories and surface pretreatment. J Mater Sci. 2004;39(1):1–49.10.1023/B:JMSC.0000007726.58758.e4Search in Google Scholar
(28) Wooley GR, Carver DR. Stress concentration factors for bonded lap joints. J Aircr. 1971;8:817–20.10.2514/3.44305Search in Google Scholar
(29) Adams RD, Peppiatt NA. Stress analysis of adhesive-bonded lap joints. J Strain Anal Eng Des. 1974;9(3):185–96.10.1243/03093247V093185Search in Google Scholar
(30) Simulia I. Abaqus User Manual v6.7, Electronic Version, Vélizy-Villacoublay, France; 2007.Search in Google Scholar
(31) Kafkalidis MS, Thouless MD. The effects of geometry and material properties on the fracture of single lap-shear joints. Int J Solids Struct. 2002;39(17):4367–83.10.1016/S0020-7683(02)00344-XSearch in Google Scholar
(32) Xie D, Waas AM, Shahwan KW, Schroeder JA, Boeman RG. Fracture criterion for kinking cracks in a tri-material adhesively bonded joint under mixed mode loading. Eng Fract Mech. 2005;72(16):2487–504.10.1016/j.engfracmech.2005.03.008Search in Google Scholar
(33) Li S, Thouless M, Waas A, Schroeder J, Zavattieri P. Use of a cohesive-zone model to analyze the fracture of a fiber-reinforced polymer–matrix composite. Compos Sci Technol. 2005;65(3):537–49.10.1016/j.compscitech.2004.08.004Search in Google Scholar
(34) Valoroso N, Champaney L. A damage-mechanics-based approach for modelling decohesion in adhesively bonded assemblies. Eng Fract Mech. 2006;73(18):2774–801.10.1016/j.engfracmech.2006.04.029Search in Google Scholar
(35) Hillerborg A, Modeer M, Petersson P. Analysis of crack formation and crack growth in concrete by means of fracture mechanics and finite elements. Cem Concr Res. 1976;6:773–82.10.1016/0008-8846(76)90007-7Search in Google Scholar
(36) Song SJ, Waas AM. Mode I failure of laminated polymeric composites. Eng Fract Mech. 1994;49(1):17–27.10.1016/0013-7944(94)90107-4Search in Google Scholar
(37) Xie D, Waas AM. Discrete cohesive zone model for mixed-mode fracture using finite element analysis. Eng Fract Mech. 2006;73(13):1783–96.10.1016/j.engfracmech.2006.03.006Search in Google Scholar
(38) Viana G, Carbas R, Costa M, Banea M, da Silva L. A new cohesive element to model environmental degradation of adhesive joints in the rail industry. Proc Inst Mech Eng Part C J Mech Eng Sci. 2021;235(3):560–70.10.1177/0954406220948901Search in Google Scholar
(39) Choupani N. Mixed-mode cohesive fracture of adhesive joints: Experimental and numerical studies. Eng Fract Mech. 2008;75:4363–82.10.1016/j.engfracmech.2008.04.023Search in Google Scholar
(40) Sutton MA, Boone ML, Ma F, Helm JD. A combined modeling experimental study of the crack opening displacement fracture criterion for characterization of stable crack growth under mixed mode I/II loading in thin sheet materials. Eng Fract Mech. 2000;66:171–85.10.1016/S0013-7944(00)00011-4Search in Google Scholar
(41) Biel A, Stigh U. Effects of constitutive parameters on the accuracy of measured fracture energy using the DCB-specimen. Eng Fract Mech. 2008;75:2968–83.10.1016/j.engfracmech.2008.01.002Search in Google Scholar
(42) Jahanshahi S, Chakherlou TN, Rostampoureh A. Evaluating the validity of the cohesive zone model in mixed mode I + III fracture of Al-alloy 2024-T3 adhesive joints using DBM-DCB tests. Int J Fract Mech. 2022;240:1–23.10.1007/s10704-022-00679-3Search in Google Scholar
(43) Sharma P, Singh Mali H, Dixit A. Mode-I interlaminar fracture modeling of DCB composite laminate using finite element techniques. J Braz Soc Mech Sci Eng. 2023;45:1–35.10.1007/s40430-023-04427-zSearch in Google Scholar
© 2025 the author(s), published by De Gruyter
This work is licensed under the Creative Commons Attribution 4.0 International License.
Articles in the same Issue
- Research Articles
- Flow-induced fiber orientation in gas-powered projectile-assisted injection molded parts
- Research on thermal aging characteristics of silicone rubber composite materials for dry-type distribution transformers
- Kinetics of acryloyloxyethyl trimethyl ammonium chloride polymerization in aqueous solutions
- Influence of siloxane content on the material performance and functional properties of polydimethylsiloxane copolymers containing naphthalene moieties
- Enhancement effect of electron beam irradiation on acrylonitrile–butadiene–styrene (ABS) copolymers from waste electrical and electronic equipment by adding 1,3-PBO: A potential way for waste ABS reuse
- Model construction and property study of poly(ether-ether-ketone) by molecular dynamics simulation with meta-modeling methods
- Zinc–gallic acid–polylysine nanocomplexes with enhanced bactericidal activity for the treatment of bacterial keratitis
- Effect of pyrogallol compounds dosage on mechanical properties of epoxy coating
- Preparation of in situ polymerized polypyrrole-modified braided cord and its electrical conductivity investigation under varied mechanical conditions
- Hydrophobicity, UV resistance, and antioxidant properties of carnauba wax-reinforced CG bio-polymer film
- Janus nanofiber membrane films loading with bioactive calcium silicate for the promotion of burn wound healing
- Synthesis of migration-resistant antioxidant and its application in natural rubber composites
- Influence of the flow rate on the die swell for polymer micro coextrusion process
- Fatty acid filled polyaniline nanofibres with dual electrical conductivity and thermo-regulatory characteristics: Futuristic material for thermal energy storage
- Hydrolytic depolymerization of major fibrous wastes
- Performance of epoxy hexagonal boron nitrate underfill materials: Single and mixed systems
- Blend electrospinning of citronella or thyme oil-loaded polyurethane nanofibers and evaluating their release behaviors
- Efficiency of flexible shielding materials against gamma rays: Silicon rubber with different sizes of Bi2O3 and SnO
- A comprehensive approach for the production of carbon fibre-reinforced polylactic acid filaments with enhanced wear and mechanical behaviour
- Electret melt-blown nonwovens with charge stability for high-performance PM0.3 purification under extreme environmental conditions
- Study on the failure mechanism of suture CFRP T-joints under/after the low-velocity impact loading
- Experimental testing and finite element analysis of polyurethane adhesive joints under Mode I loading and degradation conditions
- Optimizing recycled PET 3D printing using Taguchi method for improved mechanical properties and dimensional precision
- Effect of stacking sequence of the hybrid composite armor on ballistic performance and damage mechanism
- Bending crack propagation and delamination damage behavior of orthogonal ply laminates under positive and negative loads
- Molecular dynamics simulation of thermodynamic properties of Al2O3-modified silicone rubber under silane coupling agent modification
- Precision injection molding method based on V/P switchover point optimization and pressure field balancing
- Heparin and zwitterion functionalized small-diameter vascular grafts for thrombogenesis prevention
- Metal-free N, S-co-doped carbon materials derived from calcined aromatic co-poly(urea-thiourea)s as efficient alkaline oxygen reduction catalysts
- Influence of stitching parameters on the tensile performance and failure mechanisms of CFRP T-joints
- Synthesis of PEGylated polypeptides bearing thioether pendants for injectable ROS-responsive hydrogels
- Rapid Communication
- RAFT-mediated polymerization-induced self-assembly of poly(ionic liquid) block copolymers in a green solvent
- Corrigendum
- Corrigendum to “High-strength polyvinyl alcohol-based hydrogel by vermiculite and lignocellulosic nanofibrils for electronic sensing”