
How to define a significant deviation from the expected internal quality control result
-
Ferruccio Ceriotti
 ,
Duilio Brugnoni
,
Duilio Brugnoni

Abstract
Background: Internal quality control (IQC) is an everyday practice described in several documents. Its planning requires the definition of quality goals and a documentation system able to provide alarms as soon as the goals are not reached. We propose the use of the uncertainty approach to develop an effective alarm system.
Methods: The use of the uncertainty information to verify the conformity to specifications is described. A top-down approach to the definition of the uncertainty of the method is described. Once the uncertainty is calculated, the complete measurement result (result±expanded uncertainty) is compared with the maximum permissible error (quality goal). An alternative and more immediate presentation is obtained defining an “acceptance zone” derived from the maximum permissible error reduced on either sides by expanded uncertainty. This approach is applied to two analytes: glucose and creatinine.
Results: The relationship between quality goal and expanded uncertainty defines the width of the acceptance zone; if uncertainty is equal or larger than the quality goal, the goal is not attainable.
Conclusions: The proposed approach uses an information, expanded uncertainty, that each laboratory seeking ISO 15189 accreditation should already have. The data presentation is immediate and easy to interpret allowing a direct comparison between the performance of the method and the quality goals.
Introduction
ISO 9000 [1] defines quality control (QC) as “part of quality management focused on fulfilling quality requirements”. In clinical laboratory testing, QC includes the procedures intended to monitor the performance of a test procedure to ensure reliable results. Internal quality control (IQC) represents the whole set of activities performed to assure the constant monitoring of the performances of an analytical system with the aim of providing an alarm as soon as the analytical process fails to meet the predefined analytical goals.
ISO 15189 [2] requires that (paragraph 5.6.1) “The laboratory shall design internal quality control procedures that verify the attainment of the intended quality of results”. “Intended quality” is related to the quality goal or quality requirement for the test, which means the level of precision and trueness necessary for the method.
This goal can be accomplished for statistical QC procedures by following the guidance in CLSI C24-A3 [3]. According to CLSI C24-A3 the careful planning of an IQC procedure requires several steps:
Define the quality specification for the test;
Select the appropriate control materials;
Determine the stable (in control) performance characteristics of the measurement procedure;
Identify candidate quality control strategies;
Predict the likelihood that candidate quality control strategy will detect out-of-specification performance;
Specify desirable goals for the QC performance characteristics;
Select a quality control strategy whose predicted performance meets or exceeds the quality control performance goals.
Once selected the quality specification and the appropriate QC material a possible way to determine the in control performance characteristics of the method is to calculate the measurement uncertainty of the results produced.
The introduction of the concept of measurement uncertainty [4] led us to consider an approach to the identification of a QC strategy different from the Westgard approach and the σ-metric QC selection tool [5]. According to the International Vocabulary of Metrology (VIM) measurement uncertainty is defined as “non-negative parameter characterizing the dispersion of the quantity values being attributed to a measurand, based on the information used” [6]. The “Uncertainty Approach” assumes that the information from measurement only permits assignment of an interval of reasonable values to the measurand, based on the assumption that no mistakes have been made in performing the measurement and that “a measurement result is generally expressed as a single measured quantity value and a measurement uncertainty”.
ISO 15189 [2] at paragraph 5.5.1.4 requires “The laboratory shall determine measurement uncertainty for each measurement procedure in the examination phase …” so any ISO 15189 accredited laboratory should have already available the uncertainty data.
The proposed approach is essentially based on the following documents: JCGM 106:2012 Evaluation of measurement data – The role of measurement uncertainty in conformity assessment [7], ISO 14253-1:2013 [8] and Eurachem/Citac Guide “Use of uncertainty information in compliance assessment” [9] that describe the use of uncertainty data to prove conformity with a defined target.
Theoretical basis
Estimated measurement uncertainty shall be taken into account to prove the conformity or non-conformity with the given specification.
The complete measurement result, y′, is represented by the measurement result±measurement uncertainty (U) (Figure 1).
Conformity with a specification is proved when the complete measurement result, y′, falls within the zone defined by a lower specification limit (LSL) and an upper specification limit (USL) identifying the maximum permissible error (Figure 2A).
The same conformity can be proved similarly when the measurement result, y, falls within the zone of maximum permissible error reduced on either side by the expanded measurement uncertainty “acceptance zone” (Figure 2B).
Non-conformity of a specification is proved when the complete measurement result, y′, falls outside the maximum permissible error (Figure 3).
The problem arises when the complete measurement result, y′, includes one of the limits (Figure 4A) [or y falls outside the limits reduced by U (Figure 4B)]. In this case the knowledge of the possible values of the measurand, summarized by giving a best estimate (the measured quantity value) together with an associated measurement uncertainty, can be encoded and conveyed by a probability density function or a numerical approximation of such a function. An assessment of conformity with specified requirements is thus a matter of probability. The probability of conformity falls to 50% when the measurement result falls on the tolerance limit. However when the IQC result falls into the gray zone it implies an alarm and indicates that the probability of respecting the defined quality specification is reduced. To react or not to the alarm depends on the probability of not respecting the quality goals that one accepts.
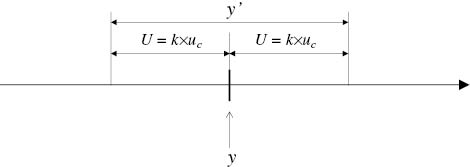
Result of a measurement, y, and complete measurement result, y′.
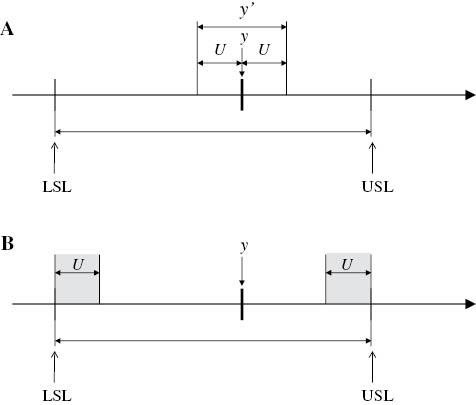
Conformance with a specification is proved.
(A) The complete measurement result falls within the maximum permissible error. (B) The measurement result falls within the maximum permissible error reduced on either side by expanded measurement uncertainty.
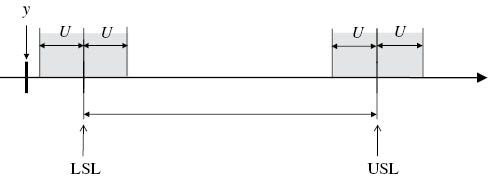
Non-conformity with a specification is proved (ULS≤y–U).
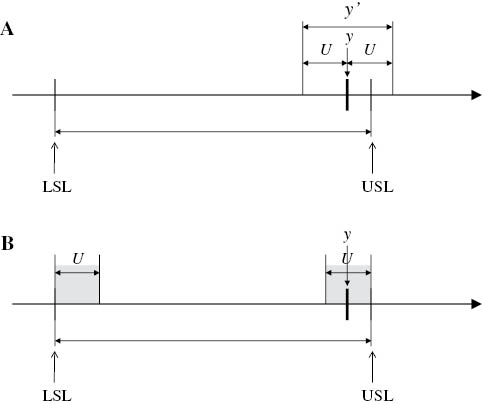
(A) and (B). Neither conformity nor non-conformity with specification can be proved.
The model is based on the following assumption:
The control materials respond to the modifications in the analytical system in a manner similar to the patients’ samples.
The measurement uncertainty has been defined in a correct manner, taking into consideration all the possible sources of variation, including bias or its correction.
The model is well applicable only if the defined quality goal is greater than the measurement uncertainty (U) otherwise no “acceptance zone” can be defined. If U is larger than the quality goal the probability of producing a result within the quality specification is lower than 95%, so one has to adopt (and communicate to the customers) a lower level of target quality (or change or modify the analytical method).
The measurement uncertainty should be periodically verified to assure its stability with time.
Calculation of measurement uncertainty
The GUM, bottom-up approach [5] is in general not applicable to the clinical laboratories. The top-down approach, as proposed by the NordTest Report [10], derives the random component of the uncertainty [intermediate precision – u(Rw)] from the results of the IQC and the systematic component by using a certified reference material (CRM). The trueness control provided by the manufacturer represents the most practical approach. A CRM produced by international organizations like NIST or IRMM might be used only if its commutability for the method in use is demonstrated. To calculate the random component of uncertainty we propose to use the weighted mean of the monthly CV of at least 6 months according to the following equation:
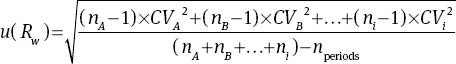
The calculation has to be performed at different concentration levels.
The bias can be calculated from the target value of the manufacturer’s trueness control (CRM) according to the following equation [10]:
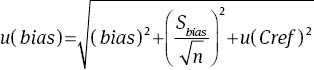
Where the bias is the % difference from the nominal or certified value
u(Cref) represents the expanded uncertainty around the certified value (but this information is often not available).
u(Cref) is usually expressed as expanded uncertainty, so:
The square root of the sum of the squares of the two components of the uncertainty gives the combined uncertainty:
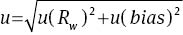
And expanded uncertainty (U) is calculated according to the equation

where k=2 for a probability of 95.5%.
Materials and methods
IQC results for glucose and creatinine are from two different clinical laboratories.
Analyzers: for glucose, Ortho Vitros 350 (Ortho Clinical Diagnostics, Milano, Italy) (Laboratory 1), for creatinine Siemens Advia 2400, alkaline picrate reagent (Siemens Healthcare Diagnostics, Milano, Italy) (Laboratory 2). Both centers used the same IQC material: Bio-Rad Liquicheck Unassayed Chemistry Control, lot 16670 (Bio-Rad Laboratories srl, Segrate (MI) Italy.
Calculation of measurement uncertainty
Glucose: u(Rw) calculated with the equation indicated in Equation 1 using 6 months IQC data (material Bio-Rad Liquicheck level 1), u(bias) calculated with the equation indicated in (2) (being u(Cref) not available it was set to zero) from replicate measurements (20) of Ortho Performance Verifier I, lot V1189 (Ortho Clinical Diagnostics, Milano, Italy).
Creatinine: u(Rw) calculated with the formula indicated in Equation 1 using 6 months IQC data (material Bio-Rad Liquicheck level 1), u(bias) calculated as indicated for glucose from replicate measurements (20) of BioRad Lyphocheck Assayed Chemistry Control (lot 14431).
Combined and expanded uncertainties were calculated using the Equations 3 and 4.
Results
Measurement uncertainty
Glucose: u(Rw)=1.16%, u(bias)=0.68%, Combined uncertainty (u)=1.34%, Expanded uncertainty (U)=2.69%
Creatinine: u(Rw)=4.69%, u(bias)=0.61%, Combined uncertainty (u)=4.83%, Expanded uncertainty (U)=9.66%
In Figure 5A is presented a control chart where the mean is represented by the mean obtained by the laboratory on the specified control material in the previous months, the acceptability limits are represented by the total allowable error (TEa) defined according to the principle of biological variation (BV), desirable limit for total error [11, 12] and the obtained results are represented as complete measurement results (result±U). It appears clearly that almost in all cases the complete measurement result falls within the maximum permissible error limits; Figure 5B shows the same results, but with the more intuitive approach presented in Figure 2B.
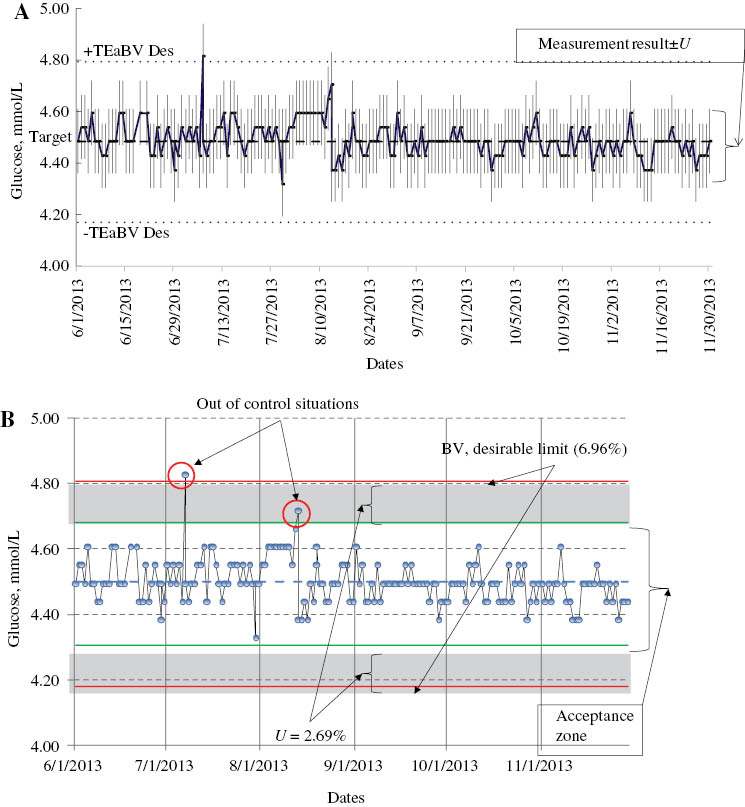
Glucose quality control chart.
(A) Glucose quality control chart. Each quality control result is presented with ± measurement uncertainty. The maximum permissible error limits are defined according to the biological variation theory as ±6.96%. (B) Same glucose quality control chart as in A, but in this case the quality control results are presented without uncertainty while it is indicated the “acceptance zone” (maximum permissible error reduced on either side by expanded uncertainty, U)
Figure 6 has the same structure of Figure 5B and presents the results for creatinine, low concentration control material (laboratory overall mean 70 μmol/L). In this case it has been impossible to adopt the desirable quality limit according to the BV principles (TEa=8.87%) [12] because U was higher (9.66%). However, also applying the minimum quality criterion (TEa=13.3%) only 52% of the data fall in the “acceptance zone”, all the others but one are in the “gray zone” indicating that we cannot guarantee, with the 95% probability, the respect even of the minimum quality specification. On the contrary, at higher creatinine concentration (460 μmol/L), 95% of the data point fall in the acceptance zone (U=6.6%) (data not shown).
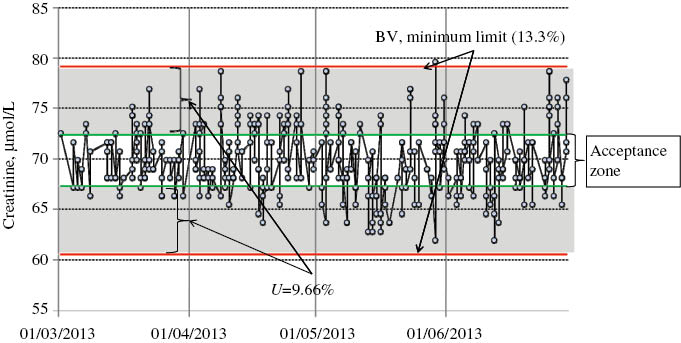
Low level creatinine quality control chart. Same as Figure 5B.
If we compare these three examples with the classical 6σ approach we found that for glucose we are almost in a 6σ situation (imprecision component of U=1.16%, small bias, TEa=6.96%, σ=5.4). For creatinine, low concentration, the σ-value is only 2.8 (even with a very limited bias component, imprecision is 4.69%), while for higher creatinine concentration the σ-value is 4.4 (imprecision=3.0%).
Discussion and conclusions
According to CLSI C24-A3 “For purposes of quality control, the laboratory must consider the stability of the analytical testing process, its susceptibility to problems that may occur, and the risk associated with an undetected error” [3]. In our opinion the proposed approach is very easy and intuitive: if the QC result falls within the “acceptance zone” it means that its complete measurement result (±U) is within the maximum permissible limit (with ≥95.5% probability), so no further actions or rules are required. With this approach the chosen quality specifications are directly indicated in the QC chart and the relationship between desired quality and performance of the method is immediately perceivable. The proposed approach works independently from the criterion applied to set the quality specifications. They can be based on true or false classification [13] as in case of total cholesterol or HbA1c, biological variation [11] or state-of-the-art [14].
We chose to apply the TEa limits as quality goals because a single measurement (like the one preformed on a control material) is always affected by both random and systematic error. Even if metrological traceability ensures that “the method” is virtually unbiased, this does not mean that its application in a specific laboratory could not introduce a certain amount of bias (calibrations, ageing of the reagents, different reagent lots etc.), so the quality goal for a single measurement remains the total error, not only the imprecision.
When the relationship between maximum permissible error (however defined) and U is >2.5 (as in Figure 5) the situation is optimal and, purporting that the reactions of the control material to possible alterations in the analytical system are similar to those of the patients’ samples, it is very easy to keep the system under control. There will be the guarantee that the vast majority of the results will respect the defined quality limits. Ideally we should strive for working in these conditions for all our tests. When U is close to or even larger than the quality specifications it will be impossible to guarantee the respect of the specifications. In such a situation, like for low level creatinine of Figure 6, the only effective solution is to change the analytical method (e.g., moving to enzymatic creatinine) or even analytical system. In the meanwhile higher frequency of calibration and maintenance could help in reducing the uncertainty level, minimizing bias, thus allowing a higher percentage of samples to respect the quality goals. Also with this approach it is possible to calculate a sort of power function curves based on the ratio between the quality specification and U and the number of IQC replicates, these data will be presented in a further publication.
Author contributions: All the authors have accepted responsibility for the entire content of this submitted manuscript and approved submission.
Financial support: None declared.
Employment or leadership: None declared.
Honorarium: None declared.
Competing interests: The funding organization(s) played no role in the study design; in the collection, analysis, and interpretation of data; in the writing of the report; or in the decision to submit the report for publication.
References
1. ISO 9000 2005 Quality management systems – Fundamentals and vocabulary. Geneva: ISO, 2005.Search in Google Scholar
2. ISO 15189 2012 Medical laboratories – Requirements for quality and competence. Geneva: ISO, 2012.Search in Google Scholar
3. CLSI. Statistical quality control for quantitative measurement procedures: principles and definitions; approved guideline, 3rd ed. CLSI document C24-A3. Wayne, PA: Clinical and Laboratory Standards Institute, 2006.Search in Google Scholar
4. JCGM 100:2008. Evaluation of measurement data – Guide to the expression of uncertainty in measurement. Available from: http://www.bipm.org/utils/common/documents/jcgm/JCGM_100_2008_E.pdf. Accessed on 24 March, 2015.Search in Google Scholar
5. Westgard JO. Six sigma quality design and control. Madison, WI: Westgard QC, 2001.Search in Google Scholar
6. JCGM 200:2012. International vocabulary of metrology – Basic and general concepts and associated terms (VIM), 3rd ed. Available from: http://www.bipm.org/utils/common/documents/jcgm/JCGM_200_2012.pdf. Accessed on 24 March, 2015.Search in Google Scholar
7. JCGM 106:2012. Evaluation of measurement data – The role of measurement uncertainty in conformity assessment. Available from: http://www.bipm.org/utils/common/documents/jcgm/JCGM_106_2012_E.pdf. Accessed on 24 March, 2015.Search in Google Scholar
8. ISO 14253-1:2013. Geometrical product specifications (GPS) – Inspections by measurement of workpieces and measuring equipment – Part 1: decision rules for proving conformity or non-conformity with specification. Geneva: ISO, 2013.Search in Google Scholar
9. Ellison SR, Williams A, editors. Eurachem/Citac guide, use of uncertainty information in compliance assessment, 1st ed., Leoben, Austria: Eurachem, 2007.Search in Google Scholar
10. Magnusson B, Naykki T, Hovind H, Krysell M. Handbook for calculation of measurement uncertainty in environmental laboratories. NORDTEST Report TR 537-2003-05.Search in Google Scholar
11. Fraser CG, Petersen PH, Libeer JC, Ricos C. Proposal for setting generally applicable quality goals solely based on biology. Ann Clin Biochem 1997;34:8–12.10.1177/000456329703400103Search in Google Scholar PubMed
12. Available from: http://www.westgard.com/biodatabase1.htm. Accessed on 24 March, 2015.Search in Google Scholar
13. Lund F, Petersen PH, Fraser CG, Sölétormos G. Calculation of limits for significant bidirectional changes in two or more serial results of a biomarker based on a computer simulation model. Ann Clin Biochem 2014 Sep 23 pii: 0004563214555163. [Epub ahead of print].10.1177/0004563214555163Search in Google Scholar PubMed
14. Haeckel R, Wosniok W. A new concept to derive permissible limits for analytical imprecision and bias considering diagnostic requirements and technical state-of-the-art. Clin Chem Lab Med 2011;49:623–35.10.1515/CCLM.2011.116Search in Google Scholar PubMed
©2015 by De Gruyter
Articles in the same Issue
- Frontmatter
- Editorial
- Defining analytical performance specifications 15 years after the Stockholm conference
- Consensus Statement
- Defining analytical performance specifications: Consensus Statement from the 1st Strategic Conference of the European Federation of Clinical Chemistry and Laboratory Medicine
- Opinion Papers
- The 1999 Stockholm Consensus Conference on quality specifications in laboratory medicine
- Setting analytical performance specifications based on outcome studies – is it possible?
- Performance criteria based on true and false classification and clinical outcomes. Influence of analytical performance on diagnostic outcome using a single clinical component
- Analytical performance specifications based on how clinicians use laboratory tests. Experiences from a post-analytical external quality assessment programme
- Rationale for using data on biological variation
- Reliability of biological variation data available in an online database: need for improvement
- A checklist for critical appraisal of studies of biological variation
- Optimizing the use of the “state-of-the-art” performance criteria
- Are regulation-driven performance criteria still acceptable? – The German point of view
- Performance criteria for reference measurement procedures and reference materials
- Performance criteria for combined uncertainty budget in the implementation of metrological traceability
- How to define a significant deviation from the expected internal quality control result
- Analytical performance specifications for EQA schemes – need for harmonisation
- Proposal for the modification of the conventional model for establishing performance specifications
- Before defining performance criteria we must agree on what a “qualitative test procedure” is
- Performance criteria and quality indicators for the pre-analytical phase
- Performance criteria of the post-analytical phase