Which cytochrome P450 metabolizes phenazepam? Step by step in silico, in vitro, and in vivo studies
-
Dmitriy V. Ivashchenko

 ,
Anastasia V. Rudik
,
Anastasia V. Rudik

Abstract
Background:
Phenazepam (bromdihydrochlorphenylbenzodiazepine) is the original Russian benzodiazepine tranquilizer belonging to 1,4-benzodiazepines. There is still limited knowledge about phenazepam’s metabolic liver pathways and other pharmacokinetic features.
Methods:
To determine phenazepam’s metabolic pathways, the study was divided into three stages: in silico modeling, in vitro experiment (cell culture study), and in vivo confirmation. In silico modeling was performed on the specialized software PASS and GUSAR to evaluate phenazepam molecule affinity to different cytochromes. The in vitro study was performed using a hepatocytes’ cell culture, cultivated in a microbioreactor to produce cytochrome P450 isoenzymes. The culture medium contained specific cytochrome P450 isoforms inhibitors and substrates (for CYP2C9, CYP3A4, CYP2C19, and CYP2B6) to determine the cytochrome that was responsible for phenazepam’s metabolism. We also measured CYP3A activity using the 6-betahydroxycortisol/cortisol ratio in patients.
Results:
According to in silico and in vitro analysis results, the most probable metabolizer of phenazepam is CYP3A4. By the in vivo study results, CYP3A activity decreased sufficiently (from 3.8 [95% CI: 2.94–4.65] to 2.79 [95% CI: 2.02–3.55], p=0.017) between the start and finish of treatment in patients who were prescribed just phenazepam.
Conclusions:
Experimental in silico and in vivo studies confirmed that the original Russian benzodiazepine phenazepam was the substrate of CYP3A4 isoenzyme.
Introduction
Phenazepam (bromdihydrochlorphenylbenzodiazepine) is the original Russian benzodiazepine tranquilizer, invented in 1975 by Pharmacology Research Institute (Moscow) in the former USSR [1], [2], [3]. Phenazepam belongs to 1,4-benzodiazepines (like diazepam, temazepam, oxazepam, and nordazepam), and contains a bromine atom [1], [3], [4]. Phenazepam is a classical GABA agonist. The drug is now produced and administrated in post-Soviet countries (Russian Federation, Belarus, Lithuania, and other CIS countries). The drug is used in a wide range of situations, including the treatment of anxiety disorders, insomnia, agitation, alcohol withdrawal syndrome, and seizures [1], [5], [6], [7]. Daily dose can range from 1 mg to 10 mg (the latter used particularly for alcohol withdrawal syndrome) [1], [2]. In other countries, phenazepam is notoriously misused and taken recreationally [4]. This is due to phenazepam being produced during the cold war for military purposes: therefore, the drug was not known to the rest of the world and was not included in the World Health Organization’s drug registers [4]. Misusers store phenazepam as a powder in small bags of up to 20 g. This is a highly potent benzodiazepine (like clonazepam), and misusers use the substance in dangerous quantities of over 2 g to relax. Fatal and life-threatening consequences are not rare among phenazepam abusers [8], [9].
Although phenazepam was invented about 40 years ago, there is still only limited knowledge about its metabolic liver pathways and other pharmacokinetic features. The half-life period is approximated between 7.5 and 60 h according to several small studies in rats, miniature pigs [10], [11], [12], and humans [13]. It was found that the metabolic pathway is the mechanism of aromatic hydroxylation with cytochrome P450 enzymes in the liver [13]. The three main metabolites of phenazepam were also established (Figure 1): 3-hydroxyphenazepam, 5-bromo-(2-chlorophenyl)-2-aminobenzophenone (ABPH) (or 2-amino-5-bromo-2-chlorophenylbenzophenone [ABCB]), and 6-bromo-(2-chlorophenyl) quinazoline-2-one (QNZ) [1], [2], [3], [13]. It is worth noting that ABPH (ABCB) and QNZ are only pharmacodynamically affected in overdose cases [2], [4], [8], [12].
![Figure 1: Phenazepam and three main metabolites.(A) Phenazepam; (B) 3-hydroxyphenazepam; (C) 5-bromo-(2-chlorophenyl)-2-aminobenzophenone (ABPH) (or 2-amino-5-bromo-2-chlorophenylbenzophenone [ABCB]); (D) 6-bromo-(2-chlorophenyl) quinazoline-2-one (QNZ).](/document/doi/10.1515/dmpt-2017-0036/asset/graphic/j_dmpt-2017-0036_fig_001.jpg)
Phenazepam and three main metabolites.
(A) Phenazepam; (B) 3-hydroxyphenazepam; (C) 5-bromo-(2-chlorophenyl)-2-aminobenzophenone (ABPH) (or 2-amino-5-bromo-2-chlorophenylbenzophenone [ABCB]); (D) 6-bromo-(2-chlorophenyl) quinazoline-2-one (QNZ).
However, there is a question – which cytochrome realizes the phenazepam’s metabolism? To date we only have an assumption that CYP3A isoenzymes are the most probable metabolizers of phenazepam; however, there have been no experimental or clinical studies to confirm the assumption [3], [14], [15].
Determining the metabolic pathway of phenazepam is important for the following:
Predicting unwanted drug–drug interactions due to intake of CYP450 substrates, inducers, or inhibitors (as for patients as for abusers);
Investigating the pharmacogenetics of phenazepam’s efficacy and safety (in countries where that drug is used for treatment);
Narrowing the scope of further investigations of phenazepam’s pharmacokinetics in forensic, toxicology, and clinical medicine.
The objective of the study was to determine the CYP450 isoenzyme that metabolizes phenazepam with digital modeling (in silico) and experiment in cell cultures (in vitro).
Materials and methods
The present study was planned and designed by the authors, and the research was approved by the Local Ethical Committee of Russian Medical Academy of Continued Professional Education on 13.09.2016 (Protocol No. 9). The complete study was divided into three stages: in silico modeling, in vitro experiment (cell culture study), and in vivo confirmation.
First stage: In silico prediction of cytochrome P450-mediated biotransformation of phenazepam
At this stage, cytochrome’s affinities to the phenazepam molecule were evaluated. In silico modeling was performed on the specialized software PASS [16], [17] and GUSAR [18] as well as the Metabolite Biovia database [19]. Prediction of Activity Spectra of Substances (PASS) models the affinity of the substrate to the CYP450 isoenzyme. Modeling is based on a training set that contains hundreds of substrates with well-known metabolic pathways. ISIS BASE software were used to build the training set. The “Metabolite BIOVIA” [BIOVIA Metabolite Database] database was the main source of information. Phenazepam’s chemical structure was presented in PASS as MNA descriptor (MNA – Multilevel Neighborhoods of Atoms). Then, was used the model of PASS “structure – substrate to the CYP450 isoenzyme” [17], which gives 85% predictive accuracy in LOO CV.
Our in silico isoenzyme panel included the following CYP450 isoforms: 1A1, 1A2, 2A6, 2B6, 2C18, 2C19, 2C8, 2C9, 2D6, 2E1, 3A4, 3A5.
Second stage: In vitro biotransformation and identification of human cytochrome P450 isozyme-dependent metabolism of phenazepam
At this stage, the role of cytochromes CYP2C9, CYP3A4, CYP2C19, and CYP2B6 in phenazepam’s biotransformation was investigated. Each cytochrome was tested in a special experiment with both phenazepam and specific inhibitors. The concentration of the main metabolite – hydroxyphenazepam – was measured in the cultural medium after the cell’s incubation in the microbioreactor with phenazepam, inhibitors, and substrates of cytochromes P450. The influence of inhibitors on hydroxyphenazepam’s concentration was measured to determine the cytochrome associated with phenazepam’s metabolism. Substrates of cytochromes were used in order to evaluate induction of isoenzyme by phenazepam. Cytochromes were chosen according to their potential role in metabolism of benzodiazepines [15].
Cell culture:
The HepaRG cells were cultured in Williams medium E (Gibco, USA), supplemented with 2 mM L-glutamine (Gibco, Waltham, MA, USA), 10% fetal bovine serum (HyClone, South Logan, UT, USA), 5 μg/mL recombinant human insulin (Gibco, USA), 50 μM hydrocortisone hemisuccinate (Sigma, St Louis, MI, USA), and 100 u/mL penicillin and 100 μg/mL streptomycin (Gibco, USA). The cells were differentiated in the same culture medium supplemented with 2% for 14 days [20].
HepaRG spheroids were formed in U-shaped 96-well plates with low adhesion for 5 days, and incubated for additional 24 h in a serum-free culture medium composed of Williams medium E supplemented with of L-glutamine, insulin–transferrin–sodium selenite supplement (Thermo Scientific, Waltham, MA, USA), 1 μg/mL bovine serum albumin, 50 μM hydrocortisone hemisuccinate, 1% penicillin/streptomycin solution (Gibco, USA), and a mixture of non-essential amino acids (1 mM of glycine, L-alanine, L-asparagine, L-aspartic acid, L-glutamic acid, L-proline, and L-serine), (Thermo Scientific, USA). HepaRG spheroids were cultured in a Homunculus microbioreactor chip with circulating medium flow and replaceable cell chips [21].
Cell incubation with test compound:
HepaRG spheroids were loaded into a microbioreactor chip (30 samples in each well), then the culture medium was removed to dryness and replaced with a culture medium (125 μL) containing specific cytochrome P450 isoforms inhibitors and substrates (the concentrations are indicated in Table 1) and 1 μM phenazepam. Wells with medium containing 1 μM phenazepam without inhibitors and substrates were used as a control.
Substrates and inhibitors of CYP2C9, CYP3A4, CYP2B6, and CYP2C19 used in in vitro experimentation to investigate phenazepam’s metabolic pathways.
| CYP450 | Substrates | Inhibitors | |||
|---|---|---|---|---|---|
| Name | Concentration | Name | Concentration | Ki | |
| CYP2B6 | Bupropion | 10 μM | 2-Phenyl-2-(1-piperdinyl)-propane | 1 μM | 5.1 μM [22] |
| CYP2C19 | Omeprazole | 20 μM | (+)-N-3-benzyl-nirvanole | 1 μM | 0.7 μM [23] |
| CYP3A4 | Testosterone | 10 μM | Ketoconazole | 1 μM | 0.26 μM [24] |
| CYP2C9 | Tolbutamide | 40 μM | Sulfaphenazole | 5 μM | 0.13 μM [25] |
Ki – inhibition constant.
HepaRG spheroids were incubated under continuous medium flow perfusion for 24 h. After incubation, 100 μL of the medium was removed and 35 μL of −20 °C acetonitrile was added to each aliquot. Samples were analyzed for hydroxyphenazepam using an LC–MS to determine the association with phenazepam’s metabolism.
Third stage: evaluation of CYP3A activity in patients receiving phenazepam and carbamazepine
Seventy-four patients with non-complicated alcohol withdrawal syndrome were involved into this stage of research. Each patient was included in 24 h from admission to hospital and excluded at sixth day of treatment. Informed consent was collected from each participant (according to Helsinki Declaration of 1975, revised in 1983), and individual charts and digital databases did not store any personal information. Treatment comprised detoxication and phenazepam in a mean daily dose of 6.13±2.09 mg. Ten patients were prescribed carbamazepine 100 mg three times daily (300 mg/day) in addition to phenazepam. In order to examine the activity of CYP3A, urine samples were collected from each participant both at the moment of inclusion and at the sixth day, strictly in the morning before 10 am, and frozen immediately after collection and stored at −20 °C.
CYP3A activity was defined by the measurement of the 6-betahydroxycortisol/cortisol ratio in urine samples.
Chromatography–mass spectrometry
In vitro samples:
To determine hydroxyphenazepam concentration in culture medium, the LC–MS analysis was performed on LCMS 8030 LC MS/MS system (Shimadzu, Japan) in MRM mode with ZORBAX Eclipse Plus C18 column (4.6×150 mm, 5 μm, Agilent, USA) at a flow rate of 1 mL/min -1, 40 °C, gradient: 0–3 min, 100% phase A (0.425 vol.% formic acid in a 5% aqueous solution of acetonitrile); 3–11 min, linear gradient from 100% to 60% phase A; 11–13 min, linear gradient from 60% to 0% phase A; 13–15 min, 0% phase A; 15–18 min, linear gradient from 0% to 100% phase B; 18–21 min, 100% phase B (0.425 vol.% formic acid in pure acetonitrile). MRM transitions for substrates and their metabolites were described previously [20]. For hydroxyphenazepam, 366.95≥321.00 MRM transition at −22 eV was used.
In vivo samples:
The activity of CYP3A4/5 was assessed individually for each subject. Two urine samples (collected at the first and sixth day relatively) were used to determine the 6-betahydroxycortisol and cortisol levels by high-pressure liquid chromatography (HPLC) with Agilent G1978B Multimode Source for 6410 Triple Quade LC/MS (Agilent Technologies, Inc., USA). Cortisol is a specific substrate of CYP3A4/5 isoenzymes. The higher the rate of the 6-betahydroxycortisol/cortisol ratio, the higher is the activity of CYP3A4/5. The current method was modified by Smirnov V.V. (2010).
After the urine samples were defrosted, 4 mL of Ethyl Acetate/Isopropanol (in volume ratio 85/15) mixture was added to 2 mL of each sample. Samples were shaken for 10 min and centrifuged for 5 min at 1107g. The organic layer was separated, and extraction was repeated. Then, 2 mL of 1M NaOH solution was added to the combined organic layers, and the samples were shaken for 10 min and centrifuged. The organic layer was separated and evaporated by vacuum evaporator. Samples were dissolved in 1 mL of ethanol and analyzed by LC MS/MS. Determination of cortisol and 6-beta-hydroxycortisol by HPLC under isocratic reversed-phase conditions acetonitrile:water acid mobile phase (45:55) containing 0.1% of formic acid with a flow rate of 0.5 mL/min in positive ion scan mode and ultraviolet detection at 246 nm.
Statistical analysis
Statistical analysis was performed with SPSS Statistics 22.0. The Mann-Whitney and Wilcoxon criteria were used to compare the 6-betahydroxycortisol/cortisol ratio between groups and to evaluate changes after treatment.
Results
In silico analysis showed that the highest probability to metabolize phenazepam had CYP3A4, CYP2B6, CYP2C19, CYP2A6, CYP2C9, CYP2E1, and CYP3A5 isoenzymes, with lower probability that the drug is substrate of CYP1A2 and CYP2D6.
Results of computer modeling with PASS and General Unrestricted Structure Activity Relationships (GUSAR) packages are listed in Table 2. The Program “PASS (Pa-Pi)” column contains the probability if phenazepam belongs (Pa) to each CYP450 substrate or not (Pi); a higher rate means higher probability. The “PASS (Affinity)” column demonstrates quantitative rating of phenazepam’s affinity to cytochrome’s active center. The “GUSAR” column shows the qualitative assessment of phenazepam’s affinity to CYP450 – “0” means “not substrate”, “1” means “substrate”. Summarizing these results, we appropriated a special “rank” to each cytochrome, or the individual probability that phenazepam would be the substrate of current cytochrome. Our analysis defined CYP3A4 as the main pathway of phenazepam’s metabolism.
Results of prognosis of phenazepam’s affinity to CYP450 isoenzymes according to PASS and GUSAR.
| Isoenzyme | Number of substrates | PASS (Pa-Pi) | PASS (Affinity) | GUSAR | Rank |
|---|---|---|---|---|---|
| CYP1A1 | 301 | 0.244 | 0.000 | 0 | 0.244 |
| CYP1A2 | 679 | 0.464 | 0.088 | 0 | 0.553 |
| CYP2A6 | 282 | 0.730 | 0.293 | 1 | 2.023 |
| CYP2B6 | 344 | 1.000 | 0.514 | 1 | 2.514 |
| CYP2C18 | 42 | 0.084 | 0.004 | 0 | 0.088 |
| CYP2C19 | 504 | 0.600 | 0.449 | 1 | 2.048 |
| CYP2C8 | 302 | 0.000 | 0.082 | 0 | 0.082 |
| CYP2C9 | 515 | 0.691 | 0.316 | 1 | 2.007 |
| CYP2D6 | 669 | 0.298 | 0.067 | 0 | 0.365 |
| CYP2E1 | 426 | 0.533 | 0.087 | 1 | 1.620 |
| CYP3A4 | 1413 | 0.578 | 1.000 | 1 | 2.578 |
| CYP3A5 | 300 | 0.582 | 0.416 | 0 | 0.998 |
In vitro
The next step – the in vitro experiment – confirmed the in silico results for CYP3A4. The CYP3A4 specific inhibitor ketoconazole significantly decreased the concentration of hydroxyphenazepam in microbioreactor (Figure 2). Inhibitors of CYP2C19, CYP2C9, and CYP2B6 did not change the hydroxyphenazepam concentration, and their role in its pharmacokinetics is doubtful. An interesting finding in experiments with specific substrates was that phenazepam induced activity of CYP2B6: there was substantial increasing of 6-hydroxybupropion, the metabolite of bupropion (Figure 3).
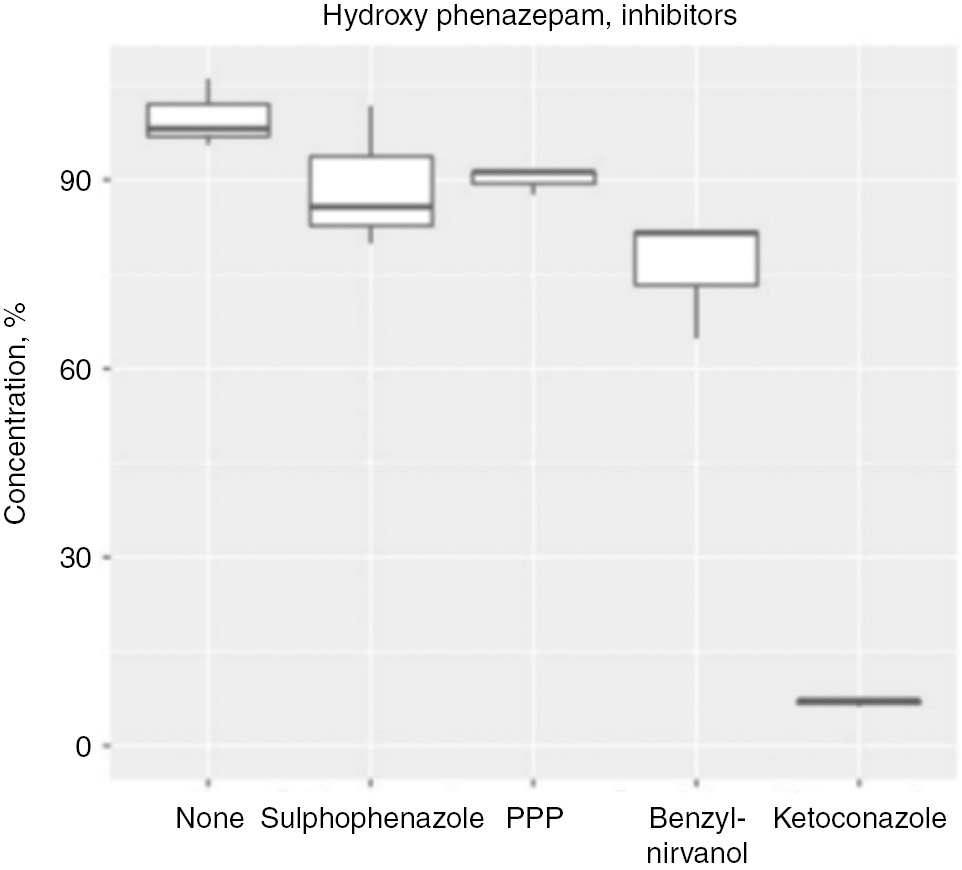
Concentration of phenazepam’s metabolite hydroxyphenazepam in five experiments with CYP450 inhibitors in microbioreactor “Homunculus”.
PPP, 2-phenyl-2-(1-piperdinyl)-propane (1 μM).

Concentration of phenazepam’s metabolite hydroxyphenazepam in five experiments with CYP450 substrates in microbioreactor “Homunculus”. “Mix” – mix of CYP450 isoenzymes’ substrates.
Each plot defines concentration of substrate’s metabolite with (right plot) and without (left plot) phenazepam. Bupropion’s metabolite concentration was higher when Phenazepam was added to mix, that says about inducible effect on CYP2B6.
Clinical study of CYP3A activity in patients which were prescribed phenazepam
We have measured CYP3A activity by the 6-betahydroxycortisol/cortisol ratio in patients. Among our sample, we had 64 patients who were prescribed phenazepam as monotherapy and 10 patients who had added carbamazepine in a fixed dose of 300 mg per day. Characteristics of patients are summarized in Table 3.
Main characteristics of patients involved in clinical study.
| Overall sample (n=74) | Phenazepam monotherapy subgroup (n=64) | Phenazepam+ Carbamazepine subgroup (n=10) | p-Value between subgroups (Mann-Whitney test) | ||||
|---|---|---|---|---|---|---|---|
| Mean | SD | Mean | SD | Mean | SD | ||
| Age, years | 41.69 | 8.25 | 41.98 | 8.38 | 39.80 | 7.41 | 0.462 |
| Phenazepam daily dose, mg | 6.50 | 2.08 | 6.55 | 1.98 | 6.20 | 2.70 | 0.859 |
| Cortisol concentration in urine at first day, ng/mL | 1753.91 | 936.23 | 1713.38 | 942.63 | 2009.21 | 898.42 | 0.344 |
| 6-Betahydroxycortisol concentration in urine at first day, ng/mL | 4212.66 | 1744.76 | 4359.83 | 1662.39 | 3285.53 | 2051.59 | 0.095 |
| 6-Betahydroxycortisol/cortisol ratio at first day | 3.51 | 3.24 | 3.80 | 3.39 | 1.70 | 0.79 | 0.014a |
| Cortisol concentration in urine at sixth day, ng/mL | 1889.73 | 925.13 | 1969.40 | 936.23 | 1387.82 | 695.89 | 0.07 |
| 6-Betahydroxycortisol concentration in urine at sixth day, ng/mL | 3536.00 | 1775.69 | 3603.93 | 1733.84 | 3108.06 | 2068.69 | 0.336 |
| 6-Betahydroxycortisol/cortisol ratio at sixth day | 2.84 | 3.15 | 2.79 | 3.04 | 3.17 | 3.99 | 0.797 |
SD, standard deviation. aSignificant difference, p<0.05.
There were no relationships between the dose of phenazepam and the 6-betahydroxycortisol/cortisol ratio changes – the Spearmen correlation coefficient was r=0.092 (p=0.442) (Figure 4).

Scatter plot of relationship between phenazepam daily dose and 6-betahydroxycortisol/cortisol ratio change between 1st and 6th days of treatment.
Spearmen correlation coefficient – r=0.092 (p=0.442). Phen – Phenazepam. 6BHC/C – 6-betahydroxycortisol/cortisol ratio. Pharmacotherapy: Phen – patients which were prescribed Phenazepam only; Phen+Carb – patients which were prescribed Phenazepam and Carbamazepine. Units: Phenazepam dose – mg.
We evaluated CYP3A activity twice: at the first and sixth day of treatment. It was expected that carbamazepine induces enzyme’s activity. Unfortunately, our sample size was insufficient to confirm or reject that hypothesis: although the 6-betahydroxycortisol/cortisol ratio increased at the sixth day, the p-value difference between the first and sixth day for that subgroup was 0.285. However, there was significant difference between the start and finish of treatment in patients who were prescribed only phenazepam. As shown in Table 4, CYP3A activity decreased sufficiently (from 3.8 [95% CI: 2.94–4.65] to 2.79 [95% CI: 2.02–3.55], p=0.017). It was interesting that the initial 6-betahydroxycortisol/cortisol ratio was significantly smaller in the phenazepam+carbamazepine subgroup (1.7±0.79 vs. 3.8±3.39, p=0.014). Be that as it may, at the sixth day, we observed inversion of that picture. Figures 5 and 6 demonstrate the changes to the 6-betahydroxycortisol/cortisol ratio in the two subgroups.
Comparisons of 6-betahydoxycortisol/cortisol ratio between subgroups and its change during treatment.
| Comparison | Subgroup | Overall sample | Phenazepam | Phenazepa+Carbamazepine |
|---|---|---|---|---|
| n | 74 | 64 | 10 | |
| 6-Betahydroxycortisol/cortisol ratio between subgroups at first day | Mean±SD | 3.51±3.24 | 3.8±3.39 | 1.7±0.79 |
| 95% CI (Lower bound – Upper bound) | 2.75–4.26 | 2.94–4.65 | 1.14–2.26 | |
| p-Value between groups (Mann-Whitney test) | – | 0.014a | ||
| 6-Betahydroxycortisol/cortisol ratio between subgroups at the sixth day | Mean±SD | 2.84±3.15 | 2.79±3.04 | 3.17±3.99 |
| 95% CI (Lower bound – Upper bound) | 2.1–3.57 | 2.02–3.55 | 0.32–6.02 | |
| p-Value between groups (Mann-Whitney test) | – | 0.797 | ||
| Change of 6-betahydroxycortisol/cortisol ratio between first and sixth days | Mean±SD | −0.68±3.82 | −1.03±3.78 | 1.46±3.56 |
| 95% CI (Lower bound – Upper bound) | −1.58 to 0.22 | −1.99 to 0.67 | −1.09 to 4.02 | |
| p-Value between first and sixth days (Wilcoxon test) | 0.052 | 0.017a | 0.285 | |
SD, standard deviation. aSignificant difference, p<0.05.

Comparison 6-betahydroxycortisol/cortisol ratio between “Phenazepam” and “Phenazepam+Carbamazepine” subgroups at 1st day.
6BHC/C – 6-betahydroxycortisol/cortisol ratio. Phen – patients which were prescribed Phenazepam only; Phen+Carb – patients which were prescribed Phenazepam and Carbamazepine. Digits are patients’ ID.
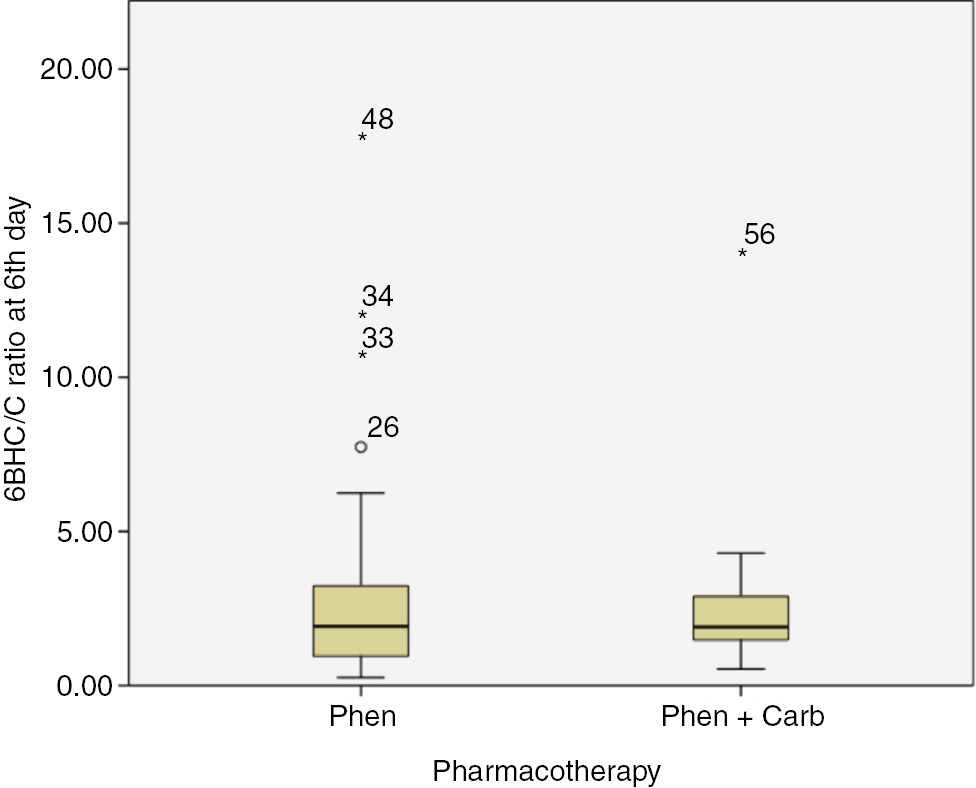
Comparison 6-betahydroxycortisol/cortisol ratio between “Phenazepam” and “Phenazepam+Carbamazepine” subgroups at 6th day.
6BHC/C – 6-betahydroxycortisol/cortisol ratio. Phen – patients which were prescribed Phenazepam only; Phen+Carb – patients which were prescribed Phenazepam and Carbamazepine. Digits are patients’ ID.
We also compared the magnitude of the change in the 6-betahydroxycortisol/cortisol ratio between the patient subgroups. There were no significant differences.
Discussion
The present study is the first effort to establish the metabolic pathways of phenazepam in the liver. We have used an experimental approach as the first step to this study.
The achieved results confirmed the role of CYP3A isoenzymes in phenazepam’s metabolism. In silico and in vitro studies independently indicated CYP3A4 as the most probable isoenzyme to oxidate phenazepam. Computer modeling has rejected CYP3A5 and attributed it to the group of “minor probability of metabolism”. This is strange because CYP3A4 and CYP3A5 share up to 80% of their substrates [26]. It could be explained by the lack of data with regard to the CYP3A5 substrates in the training set databases of in silico methods. With this knowledge, it would be careless to conclude that phenazepam is the specific substrate of CYP3A4. We suppose that CYP3A5 also metabolizes phenazepam; although we did not have an opportunity to confirm this because CYP3A5 expression is gene-determined (for example, CYP3A5*3 polymorphism carriers express CYP3A5, which might replace CYP3A4 in a liver [26]), and HepaRG cells only had a CYP3A4 isoenzyme. Consequently, this issue remains open for further research.
The observed fact that phenazepam acts as an inductor of CYP2B6 is a new and important finding. Although there was no statistical significance, further studies are essential to confirm or reject it. Bupropion is widely prescribed as an antidepressant. Therefore, the risk of drug–drug interactions with phenazepam should be known and provided to practitioners.
The clinical part of the study was conducted on inpatients who were prescribed phenazepam. It was quite difficult to build the sample of patients taking phenazepam with CYP3A inhibitors and inductors. However, 10 patients were also prescribed carbamazepine, so we evaluated CYP3A activity in conditions similar to “probable substrate + inductor” in that subsample. There was decrease in CYP3A4/5 activity in patients who were treated with phenazepam as monotherapy, and the absence of the same effect in subgroup “Phenazepam+carbamazepine”. However, if we look at numerical results, there was an increase of the 6-betahydroxycortisol/cortisol ratio in the latter subgroup (non-significant). Consequently, we only can speak about the influence of phenazepam on CYP3A activity. Moreover, according to the results of the in vitro study, inhibitory effect must be excluded. It is highly probable that phenazepam is the substrate of CYP3A4/5 (according to in silico modeling, only CYP3A4).
Limitations
We had no potency to evaluate the role of CYP2A6 and CYP2E1 isoenzymes in phenazepam’s metabolism by in vitro experiment. There were no cell cultures able to produce these enzymes and suitable substrates and inhibitors. That part will be conducted in further studies. This study is more experimental than clinical, because there were no strict rules for the in vivo section. We had no pharmacokinetic data for phenazepam in study participants, subgroups intaking concurrent substrate of CYP3A4 (midazolam) and inhibitor (ketoconazole). In addition, we had no capability to phenotype CYP2A6 and CYP2E1 activity – these enzymes were potential phenazepam metabolizers according to the in silico results. The scientific value of our experiment is in the in vitro and in silico studies that highlighted the still unknown liver metabolic pathway of phenazepam. The in vivo section was the effort to observe how phenazepam changes CYP3A activity in real clinical practice, and interactions with concurrent prescription of carbamazepine (a common combination for treatment of alcohol withdrawal syndrome).
Conclusions
Experimental studies – computer modeling and cell culture experiments in a microbioreactor – have confirmed that the original Russian benzodiazepine phenazepam is the substrate of CYP3A4 isoenzyme. That fact must be kept in mind as a source of unwanted drug–drug interactions, both in general medicine as well as in forensic toxicology. Moreover, CYP3A4 might be considered as a gene candidate in pharmacogenetics studies of phenazepam. More concise studies with pharmacokinetic knowledge of phenazepam are essential to confirm the achieved results in humans.
Author contributions: All the authors have accepted responsibility for the entire content of this submitted manuscript and approved submission.
Research funding: The in silico study was funded by a grant from the Russian Science Foundation (Project No. 14-15-00449).
Employment or leadership: None declared.
Honorarium: None declared.
Competing interests: The funding organization(s) played no role in the study design; in the collection, analysis, and interpretation of data; in the writing of the report; or in the decision to submit the report for publication.
References
1. Seredenin SB, Voronina TA, Neznamov GG, Zherdev VP. Phenazepam. 25 years in medical practice. Moscow: Nauka, 2007 [in Russian].Suche in Google Scholar
2. Phenazepam. Pre-review report. Expert committee on drug dependence, thirty-seventh meeting, Geneva. 2015. http://www.who.int/medicines/access/controlled-substances/5.8_Phenazepam_PR1.pdf?ua=1. Accessed 20 Jul 2017.Suche in Google Scholar
3. Maskell PD, De Paoli G, Seetohul LN, Pounder DJ. Phenazepam: the drug that came in from the cold. J Forensic Legal Med 2012;19:122–5.10.1016/j.jflm.2011.12.014Suche in Google Scholar PubMed
4. Lomas EC, Maskell PD. Phenazepam: more information coming in from the cold. J Forensic Leg Med. 2015;36:61–2.10.1016/j.jflm.2015.08.017Suche in Google Scholar PubMed
5. Fedorova EA, Pykhteev DM. Effects of phenazepam and aliphatic alcohols on epileptic complex created in the rat brain cortex. Neurophysiology 1994;26:365–9.10.1007/BF01053580Suche in Google Scholar
6. Voronina TA, Garibova TL. Role of Gaba-ergic and dopaminergic mechanisms in the development of the rebound syndrome after cessation of long-term administration of phenazepam. Bull Exp Med Biol 1980;89:908–10.10.1007/BF00833255Suche in Google Scholar
7. Molodavkin GM, Voronina TA, Chernyavskaya LI, Burlakova EB, Khorseva NI, Seredenin SB. Pharmacological activity of phenazepam and flunitrazepam in ultralow doses. Bull Exp Biol Med 2003;135(Suppl 7):39–41.10.1023/A:1024710225445Suche in Google Scholar
8. Corkery JM, Schifano F, Ghodse AH. Phenazepam abuse in the UK: an emerging problem causing serious adverse health problems, including death. Hum Psychopharmacol 2012;27:254–61.10.1002/hup.2222Suche in Google Scholar PubMed
9. Luzhnikov EA, Sukhodolova GN, Ostapenko YN, Kovalenko LA, Dolginov DM. Clinical toxicometry of acute poisonings by fenazepam in older children. Clin Toxicol 2010;48:282.Suche in Google Scholar
10. Boiko SS, Lyubimov BI, Smol’nikova NM, Poznakhirev PR, Motin AG. Pharmacokinetics of phenazepam in miniature pigs. Pharm Chem J (Ussr) 1979;13:896–8.10.1007/BF00777654Suche in Google Scholar
11. Golovenko NY, Zin’kovskii VG, Bogatskii AV, Sharbatyan PA, Andronati SA. Metabolism of phenazepam in the rat organism. Pharm Chem J (Ussr) 1981;14:208–13.10.1007/BF00777451Suche in Google Scholar
12. Bogatskii AV, Golovenko Y, Zinkovskii VG. Intrahepatic circulation of 14C-phenazepam and its metabolites in albino rats. Bull Exp Biol Med 1980;89:32–5.10.1007/BF00835494Suche in Google Scholar
13. Zherdev VP, Cacci S, Garattini S, Ekonomov AL. Species differences in phenazepam kinetics and metabolism. Eur J Drug Metab Pharmacokinet 1982;7:191–6.10.1007/BF03189565Suche in Google Scholar PubMed
14. Drummer OH. The forensic pharmacology of drugs of abuse. UK, London: Arnold Press, 2001.Suche in Google Scholar
15. Fukasawa T, Suzuki A, Otani K. Effects of genetic polymorphism of cytochrome P450 enzymes on the pharmacokinetics of benzodiazepines. J Clin Pharm Ther 2007;32:333–41.10.1111/j.1365-2710.2007.00829.xSuche in Google Scholar PubMed
16. Filimonov DA, Lagunin AA, Gloriozova TA, Rudik AV, Druzhilovskii DS, Pogodin PV, et al. Prediction of the biological activity spectra of organic compounds using the PASS online web resource. Chem Heterocycl Compds 2014;50:444–57.10.1007/s10593-014-1496-1Suche in Google Scholar
17. Rudik AV, Dmitriev AV, Lagunin AA, Filimonov DA, Poroikov VV. Metabolism site prediction based on xenobiotic structural formulas and PASS prediction algorithm. J Chem Inf Model 2014;54:498–507.10.1021/ci400472jSuche in Google Scholar PubMed
18. Filimonov DA, Zakharov AV, Lagunin AA, Poroikov VV. QNA-based “Star Track” QSAR approach. SAR QSAR Environ Res 2009;20:679–709.10.1080/10629360903438370Suche in Google Scholar PubMed
19. BIOVIA Metabolite Database. 2010. http://accelrys.com/products/collaborative-science/databases/bioactivity-databases/biovia-metabolite.html. Accessed 24 Aug 2017.Suche in Google Scholar
20. Zakhariants AA, Burmistrova OA, Shkurnikov MY, Poloznikov AA, Sakharov DA. Development of a specific substrate-inhibitor panel (Liver-on-a-Chip) for evaluation of cytochrome P450 activity. Bull Exp Biol Med 2016;162:170–4.10.1007/s10517-016-3567-zSuche in Google Scholar PubMed
21. Semenova OV, Petrov VA, Gerasimenko TN, Aleksandrova AV, Burmistrova OA, Khutornenko AA, et al. Effect of circulation parameters on functional status of HepaRG spheroids cultured in microbioreactor. Bull Exp Biol Med 2016;161:425–9.10.1007/s10517-016-3430-2Suche in Google Scholar PubMed
22. Walsky RL, Obach RS. A comparison of 2-phenyl-2-(1-piperidinyl)propane (ppp), 1,1′,1″-phosphinothioylidynetrisaziridine (thioTEPA), clopidogrel, and ticlopidine as selective inactivators of human cytochrome P450 2B6. Drug Metab Dispos 2007;35:2053–9.10.1124/dmd.107.015883Suche in Google Scholar PubMed
23. Suzuki H, Kneller MB, Haining RL, Trager WF, Rettie AE. (+)-N-3-Benzyl-nirvanol and (-)-N-3-benzyl-phenobarbital: new potent and selective in vitro inhibitors of CYP2C19. Drug Metab Dispos 2002;30:235–9.10.1124/dmd.30.3.235Suche in Google Scholar PubMed
24. Gibbs MA, Thummel KE, Shen DD, Kunze KL. Inhibition of cytochrome P-450 3A (CYP3A) in human intestinal and liver microsomes: comparison of Ki values and impact of CYP3A5 expression. Drug Metab Dispos 1999;27:180–7.10.1016/S0090-9556(24)15274-9Suche in Google Scholar
25. Gervasini G, Martínez C, Agúndez JA, García-Gamito FJ, Benítez J. Inhibition of cytochrome P450 2C9 activity in vitro by 5-hydroxytryptamine and adrenaline. Pharmacogenetics 2001;11:29–37.10.1097/00008571-200102000-00004Suche in Google Scholar PubMed
26. Werk AN, Cascorbi I. Functional gene variants of CYP3A4. Clin Pharmacol Ther 2014;96:340–8.10.1038/clpt.2014.129Suche in Google Scholar PubMed
©2018 Walter de Gruyter GmbH, Berlin/Boston
Artikel in diesem Heft
- Frontmatter
- Editorial
- New perspectives in personalised medicine for ethnicity in cancer: population pharmacogenomics and pharmacometrics
- Original Articles
- Which cytochrome P450 metabolizes phenazepam? Step by step in silico, in vitro, and in vivo studies
- Correlation between plasma concentrations of tramadol and its metabolites and the incidence of seizure in tramadol-intoxicated patients
- Effect of the African-specific promoter polymorphisms on the SLC22A2 gene expression levels
- Pharmacogenetic testing by polymorphic markers 681G>A and 636G>A CYP2C19 gene in patients with acute coronary syndrome and gastric ulcer in the Republic of Sakha (Yakutia)
- Homocysteine is the confounding factor of metabolic syndrome-confirmed by siMS score
- Case Report
- Remission of relapsing polychondritis after successful treatment of myelodysplastic syndrome with azacitidine: a case and review of the literature